Bitcoin plunged 3.2% due to persistent inflation
Where is BTC headed? Analysis of key support at $84,424 and risk of a deep correction
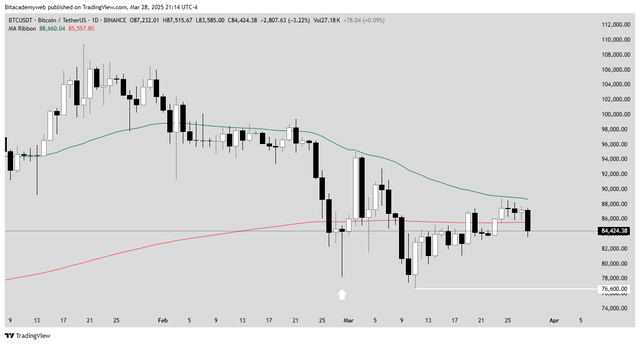
The price of Bitcoin (BTC) fell sharply (-3.22%) after new data revealed persistent inflation in the US, exceeding expectations. This reinforced fears of prolonged restrictive monetary policy by the Fed. BTC closed at $84,424.38 and was rejected by the 50 EMA, reviving bearish sentiment.

Bitcoin falls 3.2% to $84,424 on persistent inflation data. Support at $85,600? Technical analysis and scenarios for BTC.
Persistent inflation: The specter haunting the market
The Core PCE Price Index (the Fed's key inflation indicator) rose 0.4% monthly, its highest level since May 2024, exceeding the 0.3% forecast. This data, combined with the University of Michigan's 5-year inflation expectations (4.1%, the highest since 1992), raised alarms about a possible interest rate tightening.
- Effect on Bitcoin: Risk assets, such as cryptocurrencies, suffer from the prospect of "higher for longer" rates.
- Correlation with gold: Although BTC often acts as an inflation hedge, its correlation with the risk market left it vulnerable.
Bitcoin in Danger Zone
Key Levels
- Immediate resistance: $88,700 (EMA50).
- Critical support: $85,600 (EMA200). If it consolidates below, the next target would be fixed support at $76,600.
- Closing day: $84,424.38 (Binance BTC/USDT).
Volume and Liquidations
- Selling volume: 27,180 BTC (on Binance in the BTC/USDT pair), slightly above average, suggesting a balanced session.
- Liquidations: $118 million in long positions (91.18%), which amplified the decline.
Institutional Accumulation vs. Selling Pressure
- Bitcoin ETF: Net inflows of $372.7 million in one week, so institutional investment remained positive.
- Exchange outflows: -5,931 BTC in 24 hours, indicating long-term accumulation.
- Negative spot flow: -$561.2 million, indicating short-term profit-taking.
Probable Scenarios for Bitcoin
Bullish (30% probability)
- If BTC holds $85,600 (EMA200), it could rebound towards $90,000–$92,000.
- ETFs and institutional accumulation could boost demand.
Neutral (50% probability)
- Range between $76,600 and $88,700 until new macro data.
Bearish (20% probability)
- A break of $85,600 would lead to $76,600 or even $70,000–$72,000.
Buying Opportunity or Warning Sign?
The short term is neutral-bearish, but the bullish structure remains intact if it holds above $76,600. Institutional investors (via ETFs) continue to accumulate, which could limit deep declines.
Key Risk: If US inflation continues to rise, the dollar could strengthen and put further pressure on BTC.
Disclaimer: This analysis does not constitute financial advice. Cryptocurrencies are highly volatile; invest with caution and do your own research.
Upvoted! Thank you for supporting witness @jswit.