Binance Coin (BNB/ BTC) BULLRUN MODE (Technical Analyze)
Hello stemian

i will share my technical analyze about BNB/BTC
.jpg)
in the daily chart u can see, BNB still on bullish mode. the main indicator is Simple Moving Average (SMA) 50 and 100 in above of 200 SMA. Green line is 50, blue 100 , and red 200. so daily chart talked to us BNB/BTC in uptrend.
.jpg)
In a elliot wave analyze, the first pattern 1 to 5 waves has complete, and correction ABC complete its pattern to.
so the next elliot pattern is 1 to 5 pattern.
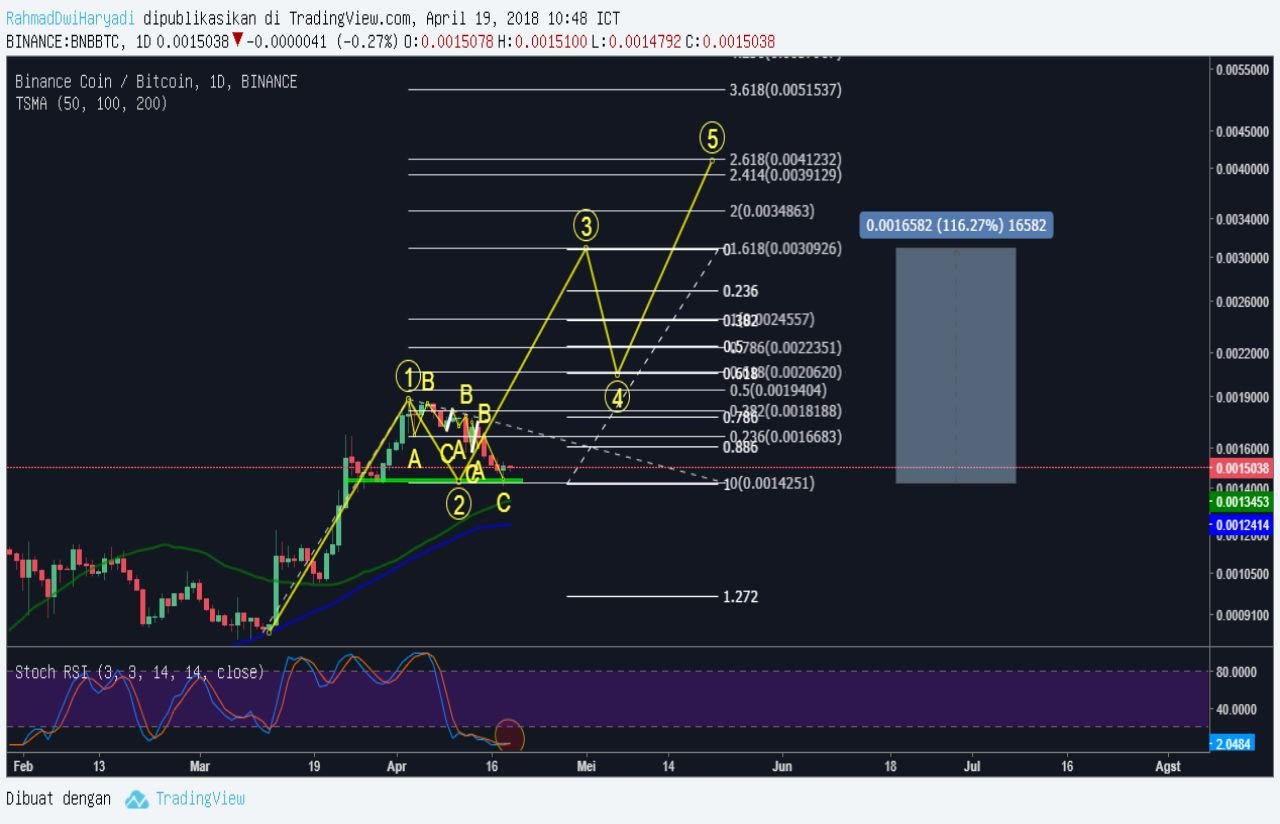
in the next elliot wave analyze, the pattern will finish second wave. You can see green zone (green box), it is near support. the near support has tested in 5 candle until it can continue bullish. so in my opinion it can be a good support to the next third elliot wave.
in the moving average show near support in green line. i think the price probably touch green line, but it must breakdown the green zone as strong support.
In a candlestick pattern, the reversal candlestick has complete. You can see the last candlestick, it is form hammer.
And the stoch RSI will be a Golden Cross
in my opinion, when BNB/BTC bounce up it will complete third wave in 1,618 fibonacci retracement level. if BNB/BTC follow the elliot wave pattern we will got 116.27 % profit.
Please comment, upvote and follow me
have a good day
Picture source : Tradingview.com
Join our telegram group
Telegram : https://t.me/THR_IC
nice analysis great work.
Resteemed your article. This article was resteemed because you are part of the New Steemians project. You can learn more about it here: https://steemit.com/introduceyourself/@gaman/new-steemians-project-launch
I dont understand
I am getting BNB coins and want to hold. it will go up soon
I will HODL it too
Analisa yg bagus dan informasi yg bermanfaat