Bull run with a Bear Sentiment
Sep 10, 2018
Bitcoin price behavior in higher time frames has been showing bearish signals all over different indicators and chart patterns but we should also consider bull run possibilities. When I say bitcoin is showing bearish signals it means that the higher probability is a drop in price and nothing is 100%.
Is it possible for bitcoin to rally and make new highs? Yes, but with a very low probability.
If the price break above descending resistance line the probability will increase dramatically but until then, in my opinion overal sentiment is bearish.

Bitcoin weekly chart shows that price is fluctuating in a descending triangle. The volatility is dropping and price is getting squeezed in this triangle pattern. Based on charts, within two months we will see a break out, which in my opinion has a significantly higher probability to be the beginning of a bear trend.

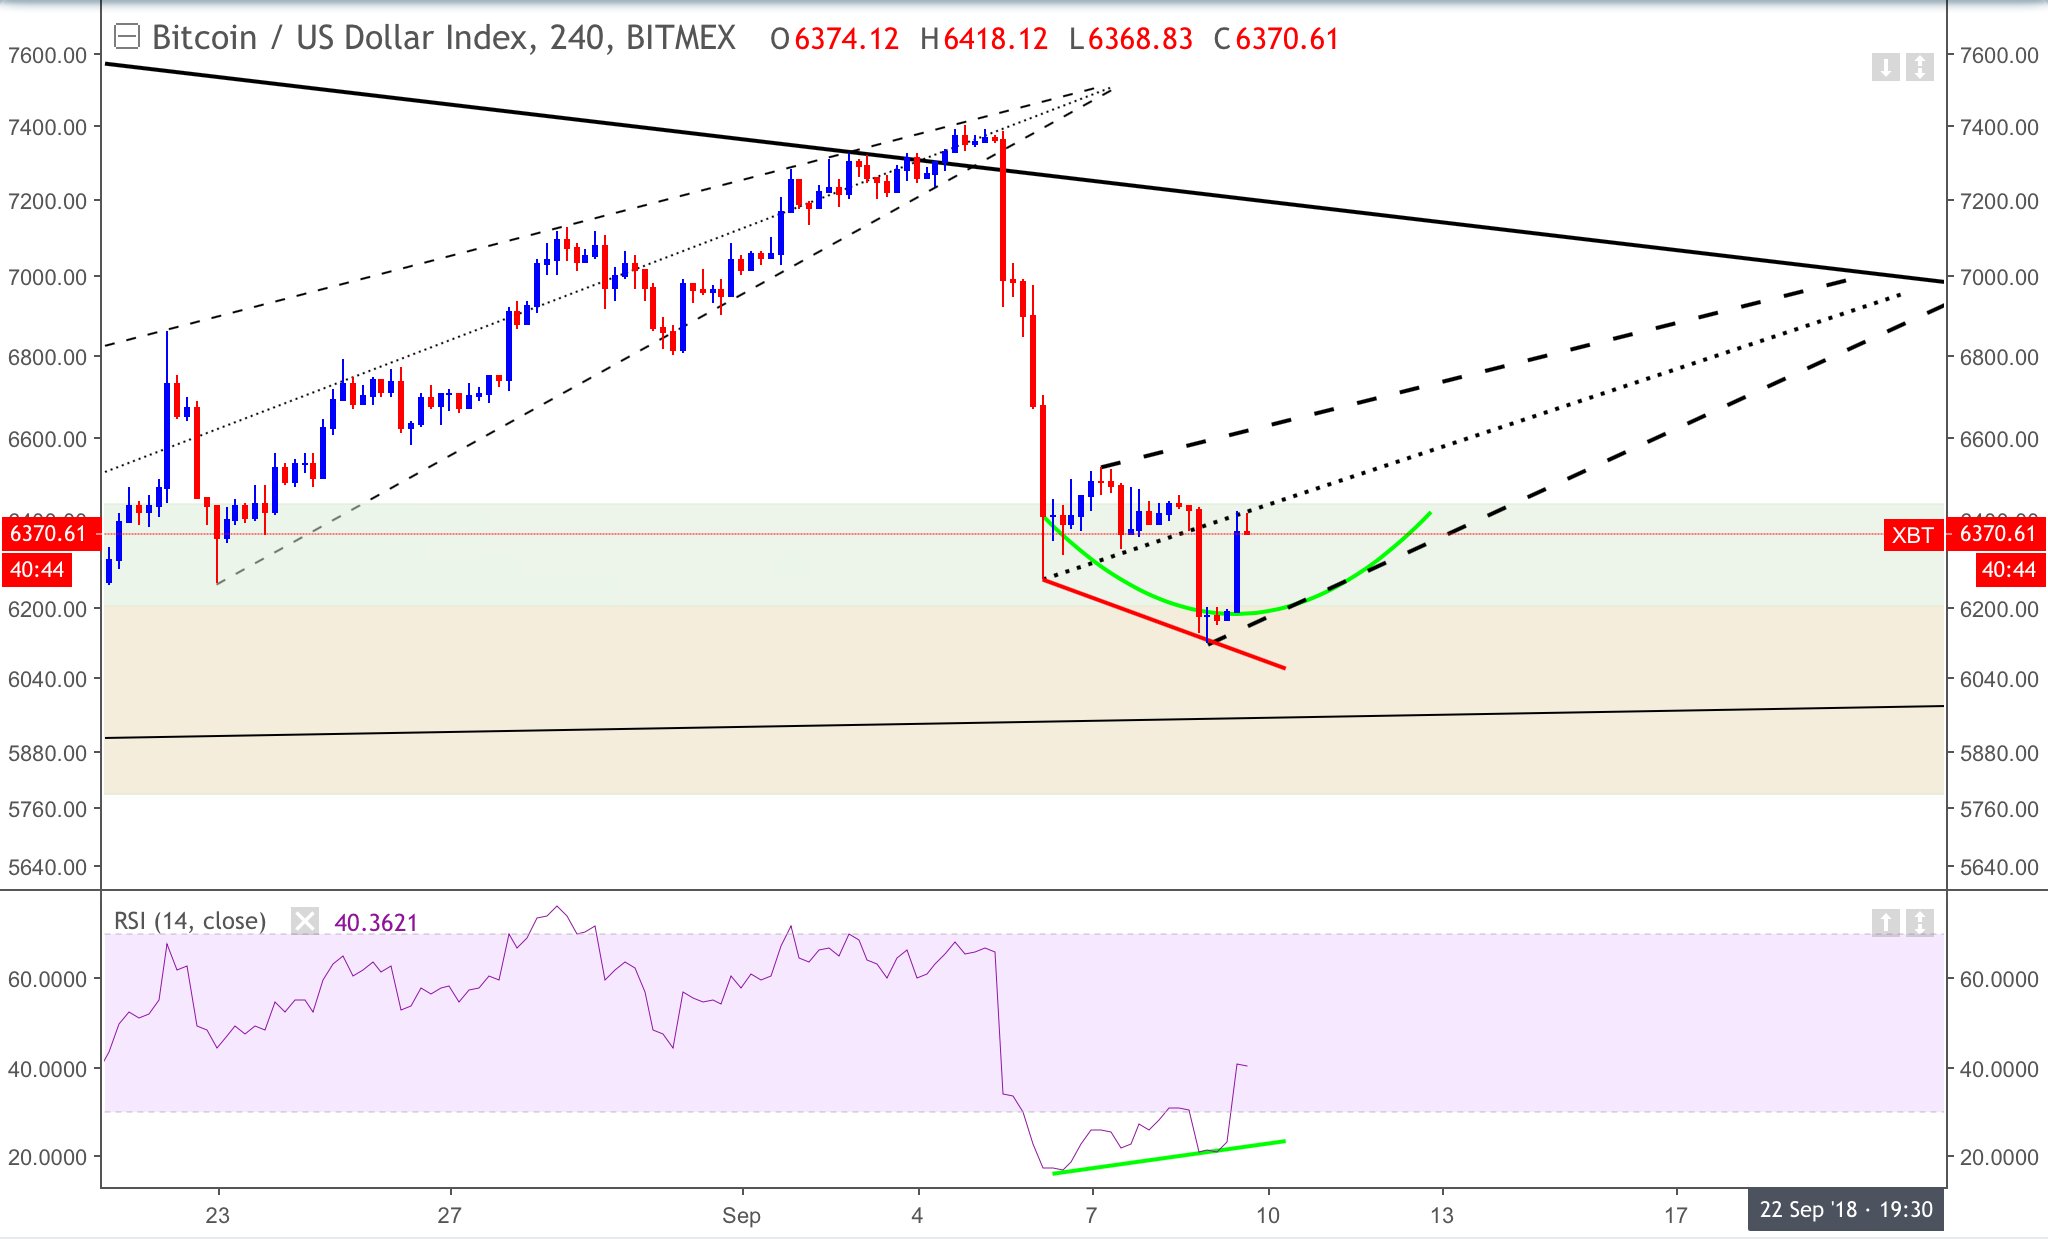
#Bitcoin RSI bullish divergence and large number of leveraged short positions suggest another bull run towards 7k. I think #btc will form another rising wedge and afterwards we will see a drop and consolidation with low volatility befor breaking out of descending triangle.