The Gradle Profiler: Part 1 Introduction
The Gradle Profiler: Part 1 Introduction
The Gradle Profiler is a tool that I’ve been using a lot lately for both my personal and work projects. It was mentioned briefly during one of the Gradle talks at Google I/O, but I feel like it needs a bit more focus.
The Gradle Profiler is a tool that lets you accurately run different build scenarios over and over again, allowing you, your co-workers, and CI to run the exact same builds, so there are no discrepancies between build times or configurations used. It can be used to compare different changes in your code and see how they affect the build speed (benchmarking), as well as look into performance issues of the build (profiling).
Step one is to get the Gradle Profiler. It can be found on Github. You will need to install it by cloning the repo or downloading the master branch as a zip file, because there hasn’t been an official release or a release strategy created yet¹.
Once you have the Gradle Profiler’s source code, run ./gradlew installDist to create a jar and startup scripts in the build/install/gradle-profiler directory. I like to add this to my path so I can reference it everywhere by updating my .bashrc with PATH=$HOME/Projects/gradle-profiler/build/install/gradle-profiler/bin:$PATH.
As mentioned before you can either benchmark or profile with the Gradle Profiler. Let’s first look at profiling. There are many options for profilers you can hook into, but for this post we will look at build scans. We will use build scans because they are free, require no setup, and can be really helpful in figuring out common builds issues.
Why use the profiler with build scans when you can already use them by themselves? The Gradle Profiler is better at running your builds with build scans because it will ensure you are using a warm Gradle daemon, that your build scripts have been optimized by the JVM, and it uses a different Gradle user home so there is no cache interference. This gives a more reliable scan for performance tuning to look at.
I’ll be using the Plaid App to demonstrate how to use the Gradle Profiler. Feel free to follow along. You can get the source code here https://github.com/android/plaid.
You can run the profiler from the command line in the plaid directory with gradle-profiler --profile buildscan --project-dir . assemble. This will run two warm up builds and then run one final build generating a build scan that will look something like this https://gradle.com/s/xdnccdd7ax674. If you click your build scan url, and if this is your first time running it you’ll need to enter your email, then you can see all the information about your build. Using the build scan to track down performance issues is out of scope for this blog post, and Gradle has lots of information on how you can use them, so I won’t be covering them here. I found this talk really helpful by the way.
Task execution timeline
To run benchmarks it’s a similar command gradle-profiler --benchmark --project-dir . assemble. Benchmarks will run six warm up builds and ten measured builds. When it’s complete you will see output like this.
- Results written to /Projects/plaid/profile-out
/Projects/plaid/profile-out/benchmark.csv
/Projects/plaid/profile-out/benchmark.html
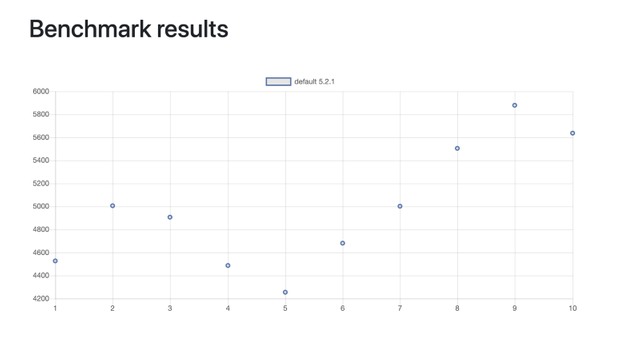
If you open up the html file you can see a graph and calculated averages, like this.
This information is interesting, but doesn’t really show us much, which is also true of our previous profile run. If our build is setup correctly, an assemble task after the first warm up should not be recompiling anything. If you are seeing tasks recompile you have some issues with how your build is setup. You shouldn’t see anything happening here other than config time. Side note: this shows how important it is to get your config time as fast as possible is.
How can we get more information out of these builds scans? For this we can use build scenarios. Scenarios are files (which can be named anything, but the convention is that they end in .scenario(s)) with type safe configuration information that describe how to run your build. For our example in the plaid app lets create a file that shows our configuration time, our clean build time, and what an ABI change looks like. The resulting file would look something like this.
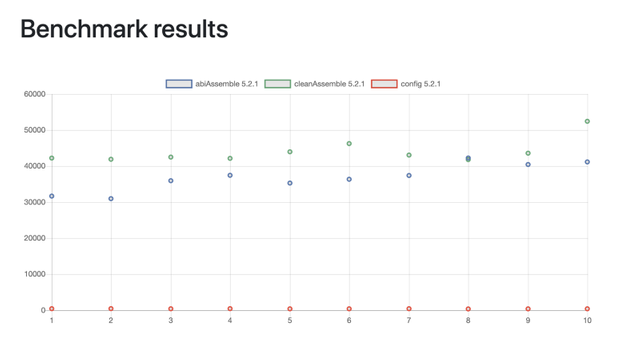
Now we can run it with gradle-profiler --benchmark --project-dir . --scenario-file profiler.scenarios.
This runs all the scenarios in the file, if you want to run a specific scenario you can pass its name to the end of that last command. If you have a lot of scenarios, consider setting a default set of scenarios with this configuration at the top of the file default-scenarios = ["cleanAssemble”] The same — scenario-file input can also be used for profiling.
Let’s go over what’s in the scenario file. First is the name: this can be anything you want. Next is the body: we use tasks to specify what tasks we want to run on each scenario. You can add as many as you’d like. There are also cleanup-tasks which are tasks that should be run between builds and not included in the profile/benchmark time. In cleanAssemble we run clean and cleanBuildCache to make sure this build is like a clean build. In abiAssemble we are using apply-abi-change-to to tell the profiler to update the Kotlin file so that it causes the public api to change, which would cause other modules to recompile. Basically the profiler adds a public function to that file.
There are a lot more parameters you can set setup, but hopefully this is enough to get you started. The data in this benchmark doesn’t really go together, so this would be a good scenario file for keeping track of build performance over time, or a using the a single scenario with a profiler to figure out issues with your build. I plan to create a few more blog posts about how we can use these scenario files to find more valuable information about our build and get our builds running in peak performance.
Big thanks to my reviewers, Kristi, Chelsea, and Renee![1]: You should vote on this issue if you want this, and hopefully someday we can install it with brew or sdkman. I did make a gradle-profiler wrapper script that you are more than welcome to try out but it’s nowhere near prime time and only works on Linux and Mac computers.


Hi! I am a robot. I just upvoted you! I found similar content that readers might be interested in:
https://medium.com/andrews-tech-blog/the-gradle-profiler-part-1-introduction-bdcbe70efe08