Technical analysis ALGO / BTC


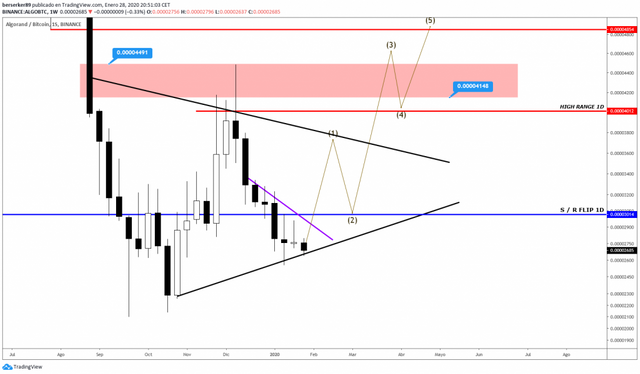
ALGO seen from the 1W timeline we can see how the current candle series has tested the support correctly leaving us with a bullish doji, the current candle is doing a confirmation test, the closing of this candle has to be bullish to have an excellent pattern to reverse the movement and move the upper resistance indicated by the black diagonal.

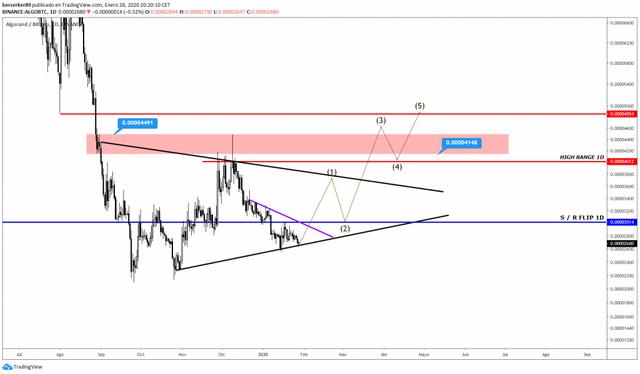
ALGO seen from the 1D time frame we can see how the candlestick structure is performing an accumulation phase, currently the price is forming an ABC range over the major trend support, indicated within the chart by the black diagonal, the current candlestick has tested the support correctly, however, we must wait for the candlestick closure for confirmation, if we get a positive close, we should see the price move towards the lower diagonal resistance, indicated within the chart by the purple diagonal, once we get the close we will have a higher momentum in search of the higher diagonal, the EW path I have plotted within the chart, however, the view is short term, the intermediate movements must be taken into account.
In conclusion, ALGO is looking very good for a reverse, the price is holding the diagonal support, we have an ABC above that level, we have the purple resistance very close, the probabilities of an upward momentum are high, the 1W and 1D scenario looks very positive, the price must not close below the diagonal support for us to see this upward scenario, therefore, I recommend to be very attentive to the 1D price action and always remember to place your stop losses to avoid possible invalidations during the move.
You can follow me on Twitter: https://twitter.com/armijogarcia
Posted from my blog with SteemPress : https://mentormarket.io/cryptocurrencies/mrbullishsail/technical-analysis-algo-btc/