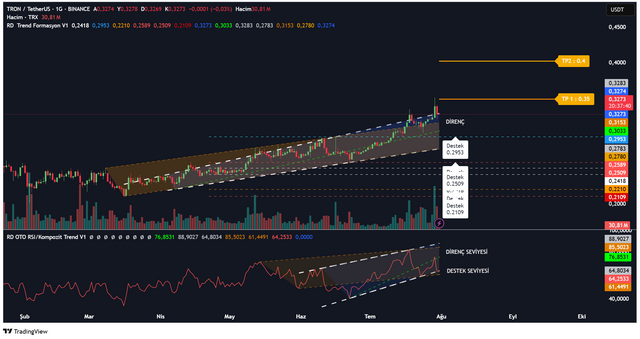
Daily chart for TRON/TetherUS.
Hello dear Steemit users. In today's post, we'll be examining the daily chart for TRON/TetherUS.
Looking at the chart based on Trend Formation, Auto RSI/Composite, and volume, we see that it's reaching resistance above the channel it's been holding since March and is currently at the support level on the RSI side. If it starts to break above average volume, the TP1 level is 0.35 and the TP2 level is 0.40.
Source:https://tradingview.com
I plan to continue my chart reading work in this way. If you have any crypto, stock, or index studies you'd like to share, please leave a comment.
The investment information, commentary, and recommendations contained herein are not within the scope of financial or investment consultancy. Investment consultancy services are provided individually, taking into account individuals' risk and return preferences. The content, commentary, and recommendations contained herein are general in nature and are not intended to be guiding in any way. These recommendations may not be suitable for your financial situation or risk and return preferences. Therefore, making investment decisions based solely on the information contained herein may not yield the results you expect.

Nice analysis about Daily chart for TRON/TetherUS