TRON TRX Price Action Analysis | 10% To @tron-fan-club
You can have your own definition of what kind of tokens are considered trustworthy, for example, some people like tokens that move with the overall market because it is relatively easy to predict. But there are also some tokens that show buying with the market in positive sentiments but do not come under much pressure during negative sentiments. And one of them is TRON TRX.
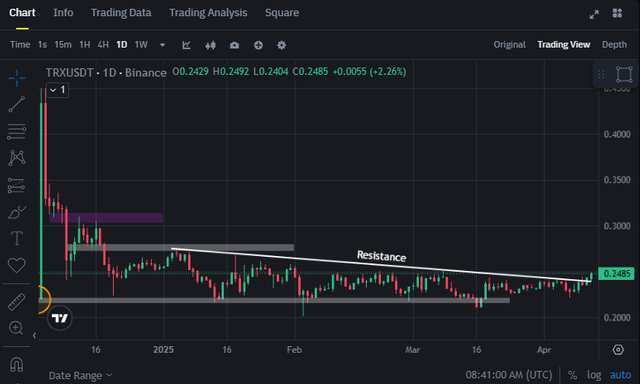
In the screenshot above, you can see the entire price action of the TRX token from December 2024 to date. The token has been in a downtrend since showing a buying momentum of close to 100% in early December. To highlight this, I have marked a resistance line in the screenshot above. According to this, the life of this downtrend has been around 4 months so far. Every time the price came close to the resistance, selling was recorded except in yesterday's trading day. Let's take a closer look at it.
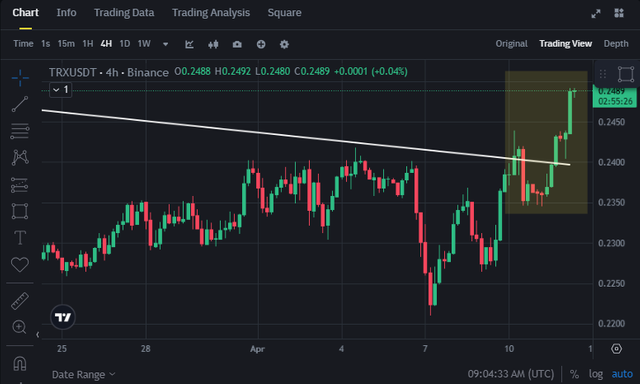
I am talking about the area marked in yellow on the right in the screenshot above. After a big selling candle near the resistance, buyers regaining control is a sign of a change in the trend of this token. However, apart from the sloping resistance, there is also a resistance level near 0.25 which cannot be ignored at all. In such a situation, there can be chances of trapping and to avoid it, a buying position can be created here with a strict SL order. Till now I was trading this token with a neutral perspective and at present, until the 0.25 level is broken with the dominance of the bulls, I am going to adopt a wait and watch strategy in this, but I guess that if the price goes above this, then a good momentum can be seen in it.
Upvoted! Thank you for supporting witness @jswit.
TRON TRX Price Action Analysis is a great post you have shared.