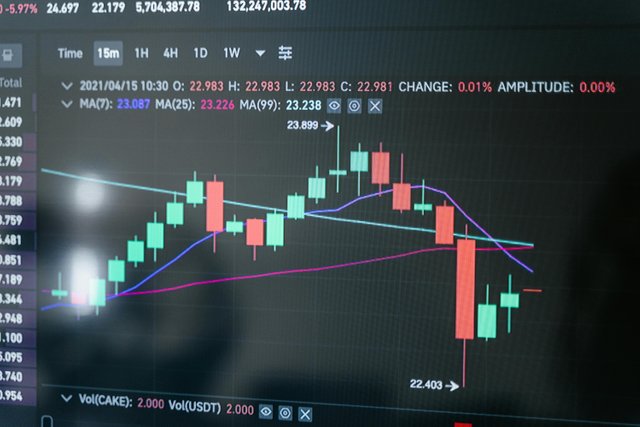
RSI (Relative Strength Index)
The RSI is the one of the most frequently used technical indicators in trading that measures the strength of the price movement in markets. The RSI, derived by J. Welles Wilder, has proven helpful in identifying overbought and oversold states that can be applied by investors to predict potential change in trends.
The RSI is calculated to give a reading between 0 and 100, derived from the average of gains and losses over a fixed period, usually over 14 days. If the RSI reading comes above 70, that particular security is said to be overbought and might therefore be due for a retreat or correction. On the other hand, if a reading falls below 30, it simply means a security is becoming oversold and may then bounce upwards.
Traders use RSI very often for confirmation of the price trend or divergence. For example, if the RSI moves in the opposite direction to the asset's price, this may indicate a weakening trend or an impending reversal. Moreover, levels around 50 are considered neutral, with movement above or below considered to indicate bullish or bearish momentum, respectively.
This makes it complementary to other technical analysis indicators, such as moving averages, in order to provide more accurate results or a broader view of the markets. In this way, RSI will enable traders to be one step ahead in price movements and help them make better decisions.
Thanks
~ Nesaty

It is a great article of RSI (Relative Strength Index).