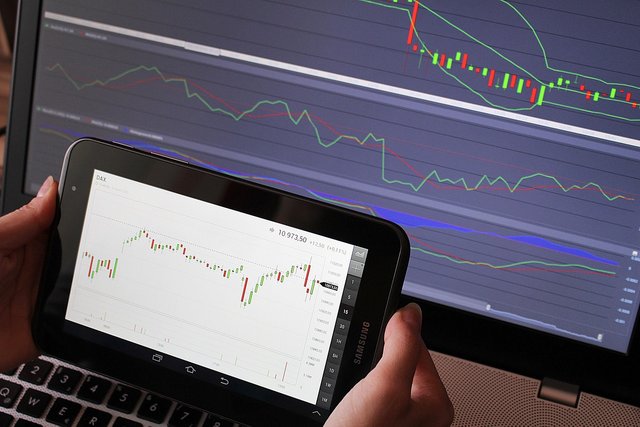
Knowing these four prices gives a basic shape to the candlestick in crypto!
A candlestick generally consists of three parts:
Upper shadow line, located at the top of the candlestick, indicates the price range between the highest price and the closing price or opening price. Whether it is related to the closing price or the opening price depends on whether the candlestick is bullish or bearish. It's like a match; the small part that protrudes at the top is the upper shadow line.
The body, this part represents the price range between the opening price and the closing price. Common bullish candlesticks are usually red or white, indicating that the closing price is higher than the opening price, meaning it has risen; bearish candlesticks are typically green or black, representing that the closing price is lower than the opening price, meaning it has fallen. You can think of the body as a rectangle, with the closing price at the top and the opening price at the bottom for a bullish candlestick, and vice versa for a bearish candlestick.
Lower shadow line, located at the bottom of the candlestick, similar to the upper shadow line, is the price range between the lowest price and the opening price or closing price, and it also depends on whether the candlestick is bullish or bearish. Again, think of a match; the small part that protrudes at the bottom is the lower shadow line. Next, let's talk about how to interpret candlesticks, which is key to reading charts.
First, look at the single candlestick. A bullish candlestick means the market has risen during that period, while a bearish candlestick indicates a decline. This is easy to understand. Next, consider the size of the body; the longer the body, the stronger the market's momentum. A long bullish candlestick indicates strong upward momentum, like someone pushing you hard from behind when you are running; a long bearish candlestick indicates strong downward momentum, like someone pulling you hard when you are running.
The length of the shadow line also has significance; the longer the shadow line, the stronger the resistance or support the market encounters in that direction. A long upper shadow line indicates significant resistance during the upward movement, as if there is a wall in front; a long lower shadow line indicates strong support during the downward movement, as if there is a large stone pulling you down.
Next is the candlestick combination, which is like observing the movements of a group of people, allowing for deeper insights. Double bottom, also known as W bottom, looks like a 'W'; this is a signal for the market to transition from decline to rise, like a person squatting down about to stand up; double top, also known as M top, looks like an 'M'; this is a signal for the market to transition from rise to decline, like a person jumping up about to fall down.
Head and shoulders bottom and head and shoulders top; the head and shoulders bottom looks like a person bowing their head with shoulders on both sides, indicating a market reversal to an upward trend; the head and shoulders top looks like a person tilting their head back with shoulders on both sides, indicating a market reversal to a downward trend. Pregnant line, just like a mother carrying a baby, with a large candlestick in front and a small candlestick enclosed behind, usually indicates that the market might reverse, like a change in the weather.
Doji, where the opening price and closing price are nearly the same, looks like a 'cross', indicating a balance of power between bulls and bears, with neither side having an advantage. If it appears at a high point, it may indicate a peak; if it appears at a low point, it may indicate a bottom. Red three soldiers and three crows; red three soldiers are three consecutive bullish candlesticks, like three little soldiers advancing bravely, indicating a strong upward market; three crows are three consecutive bearish candlesticks, like three crows cawing, indicating a weak downward market. However, be cautious, as three crows during an upward trend may indicate the bulls are gathering strength, and there may be further rises ahead.
Finally, when looking at candlesticks, it is important to consider their position and volume. Position is particularly important; the same candlestick can have different meanings depending on its location. For example, a long upper shadow during the initial stage of an upward trend may indicate that the main force is testing the market to see how strong the selling pressure is; if it appears at the end of an upward trend, it may indicate a peak and prepare for a decline.
Volume refers to trading volume, which is an important indicator to determine market trends. A bullish candlestick with high volume indicates many buyers and strong upward momentum; a bearish candlestick with high volume may indicate many sellers and strong downward pressure. So, how about it? Doesn't it feel like candlesticks aren't that difficult anymore? Quickly take out a candlestick chart and compare it; with practice, you'll soon be able to understand it!

Upvoted! Thank you for supporting witness @jswit.
tweet link
@tipu curate
Upvoted 👌 (Mana: 1/8) Get profit votes with @tipU :)
Knowing these four prices gives a basic shape to the candlestick in crypto is a great post you have shared.