Moving Charts: TRX Value Per Coin Analysis | 10% To @tron-fan-club
Hello and welcome to everyone at the Tron fan club. TRX has been performing great in the last few months. This was another eventful week for TRX. We have seen the token lose and then gain a substantial amount of value. Today we look back at the price movements of TRX over the last few days.

Made with Canva.

TRX has been experiencing a long consolidation period from start of this year, with its price fluctuating in a range. But recently, it gained strength and started going up. While many other cryptocurrencies is experiencing sigficant gain, TRX is pretty stable and slowly gaining value. This week started with TRX slowly going up.
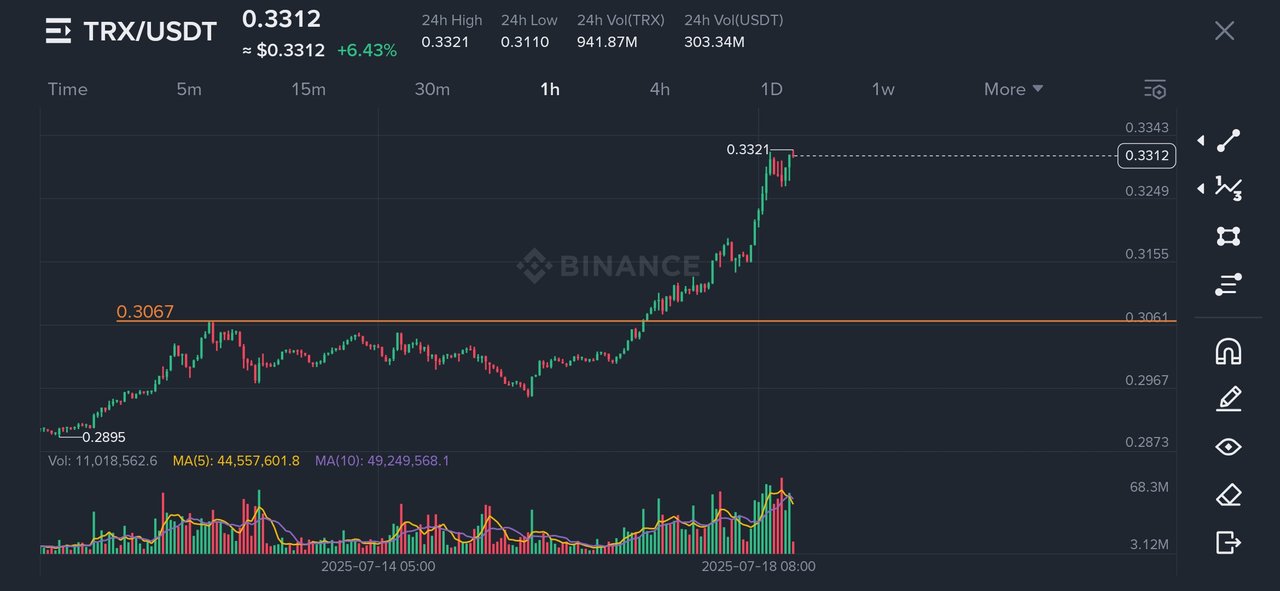
The week started with TRX eyeing to break the resistance at 0.306$. TRX eventually became successful at breaking the resistance and started going upwards after that. TRX was just above 0.296$ only seven days ago. After the breakthrough at 0.306$, it is now rising. TRX gained 11.8% value in a span of seven days. It is still below the resistance zone of 0.306$. So, it needs to hold onto the support below at 0.306$ and break-though the resistance. Now, TRX is hovering around 0.331$.
All Screenshots are taken from Coingecko
No words from this article should be taken as financial advice.
VOTE @bangla.witness as witness

OR

https://x.com/Arsalaan00070/status/1946167284005036427?t=SIp2fX4ov_3NM-iA89-3HA&s=19
Hello @arsalaan, it is really amazing that you have done such an analysis on TRX. You have explained the whole thing, step by step, price movements and support-resistance. I got a clear idea about the current trajectory of TRX. Best of luck to you