Introduction to the Principles of Crypto Analysis - Crypto Academy S4W7 - Homework Post for @imagen

Fundamental Analysis
Fundamental analysis differs from technical analysis in that the former entails determining a stock's intrinsic or inherent worth via the examination of several aspects. Analysts examine aspects that may have an influence on the security's intrinsic value in this respect.
Technical Analysis
While a fundamental study of a company takes into consideration a variety of elements, technical analysis only considers historical data immediately relevant to the stock. The main distinction between fundamental and technical analysis is this.
Difference between Fundamental and Technical Analysis
| Parameter | Technical analysis | Fundamental analysis |
|---|---|---|
| Purpose | Analyzing previous price movements and transaction volumes to determine the future patterns of an asset or market. | Financial performance, management, and overall market circumstances are all used to determine a security's fundamentals. |
| Usage | It is commonly used by investors for short-term trading. | It is mostly used by market players for long-term investment. |
| Buy and sell signal | Trend lines, Support and resistance and momentum-based indicators. | Overvalued and undervalued cryptocurrency. |
| Data | Technical analysis is exclusively concerned with historical data. | Fundamental analysis considers both historical and current data. |
| Type of traders | Swing traders and short-term day traders both embrace technical analysis. | Long-term position traders tend to use fundamental analysis. |
Long-term investments require fundamental analysis, and short-term investments require technical analysis. Fundamental research allows analysts to estimate future performance using financial records from a firm, whereas technical analysis allows analysts to determine if prior stock price patterns will repeat in the future. Technical analysis simply evaluates historical data, but fundamental analysis considers both past and current data.
Cardano (ADA) is a blockchain platform based on the Ouroboros consensus algorithm, which validates transactions efficiently. Cardano is written in Haskell, which allows it to pursue evidence-based development for unsurpassed security and stability. Ada Lovelace, a 19th-century mathematician, is the name of the blockchain's native coin, ADA.
Uses of Cardano (ADA)
• The levels of accounting and calculation are separated.
• The cardano coin may be used to transmit value in the same way that cash is currently. ADA is comparable to other cryptocurrencies such as Ethereum and bitcoin, however it has more uses.
• One of Cardano's core innovations is its Proof-of-Stake blockchain design, in which ADA is staked to the blockchain to help stake pool managers in accurately confirming transactions on the blockchain. The cardano cryptocurrency comes into play here. Those that stake their ADA on the blockchain are rewarded with more cardano coins in exchange. This staking strategy helps to the overall security of the blockchain.
Who created cardano?
Charles Hoskinson is the creator of Cardano and the co-creator of Ethereum, two of the most popular Cryptocurrencies. In the beginning, he saw the need for a more standardized and scalable blockchain. With his background in mathematics, Hoskinson began to think about more scientific ways to build a blockchain. Around this time, Jeremy Wood, a former Ethereum employee who wanted to build a better blockchain and smart contracts platform, contacted Hoskinson. They began developing cardano in its current state.
Metric Analysis
Metric analysis is one of the elements to examine while performing basic analysis. For metric analysis, we'll examine at things like market capitalization, volume, circulating supply, and liquidation, among other things.
The Cardona (ADA) token specifications on coinmarketcap are provided below, as seen in the screenshot below, as of the time of writing this piece.
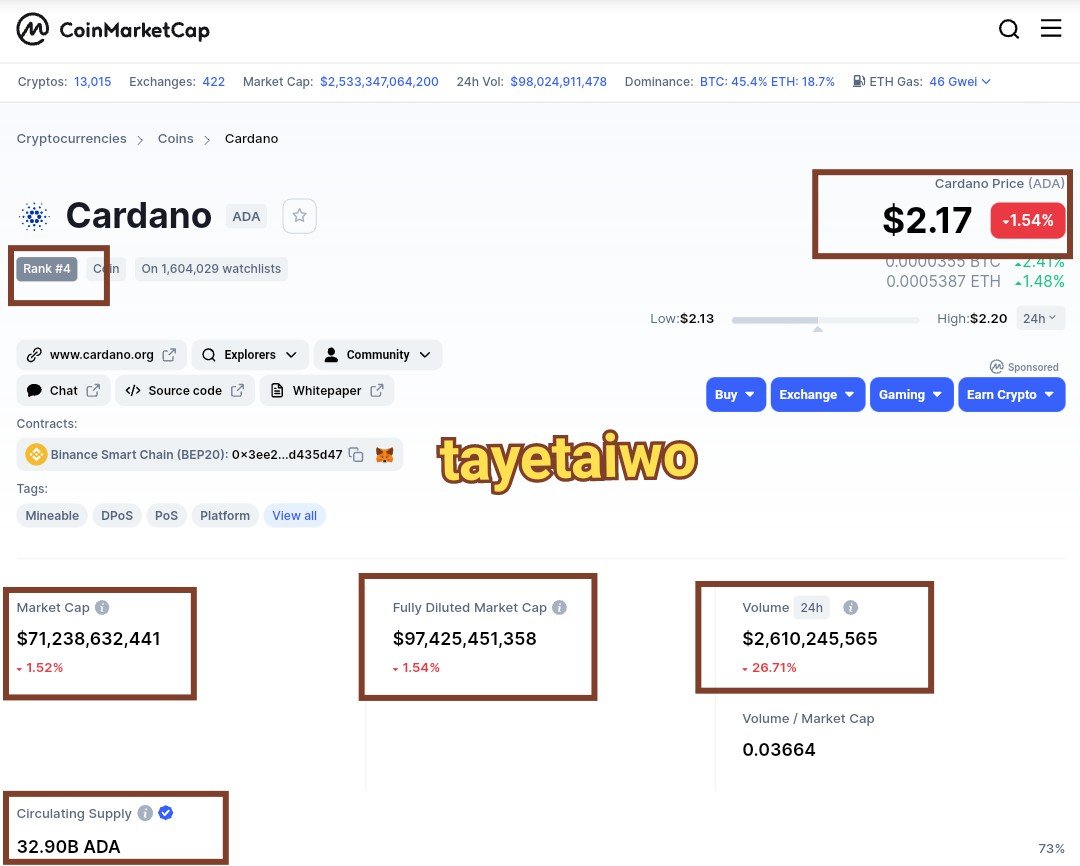
Price $2.17
Rank 4
Market Capitalization $71,238,632,441
Volume $2,612,905,286
Circulating supply 32,904,527,669 ADA
Fully diluted market cap $97,425,451,358
Total Circulation Supply
The quantity of tokens in circulation is referred to as the circulating supply. Cardona (ADA) has a circulating supply of 32,904,527,669 ADA. This refers to the total amount of tokens held by the whole population.
Total Supply
The total supply is the number of coins left after subtracting the burnt and withdrawn tokens from the total number of coins or tokens in circulation. Cardona tokens have a total quantity of 33,250,650,235 ADA.
Maximum Supply
The maximum supply refers to the total number of tokens available in the future. Each token is one-of-a-kind, and the value varies. Cadona tokens are limited to 45,000,000,000 ADA total quantity.

On-Chain Metric
To gather data for on-chain metric analysis, the Cardona block explorer will be used. These statistics are quite valuable in determining how the project's future will look.
I'm going to use Cardona's block explorer for this. I'll open the cardanoscan.io block explorer and provide some information.
There are a total of 6407126 blocks that have been created. 16167671 transaction.


The second details we'll look at is the number of tokens that have been staked or locked. This is crucial information for our fundamental analysis. ADA is worth 23.57 billion.

In consideration of all of this information, we may conclude that the ADA coin has a solid basis and a bright future. Despite its high price, it still has a long way to go. The price will continue to climb in the future.
• Make a purchase of at least 10 USD of the currency you choose in the previous step from your verified account. Describe the procedure in detail. (Display Screenshots)

• I begin the process of purchasing ADA by going to my Binance exchange app. I chose the market option.

• I typed the ADA/USDT pair into the search box and then clicked on it when it showed.

• I selected the Buy option because I intend to make a purchase.

• I spend $10 to buy one ADA coin at the current market price of $2.163.

• confirmation of the trade I made from my Binance account

In this section of the task, I will be using the Tradingview platform. I select the ADA/USDT trading pair and change the time stamp to 4 hours.

The next step is to click on the options so I can plot my the Fibonacci retracement level, and a list of different analytical tools appears, including the Fibonacci retracement tool.
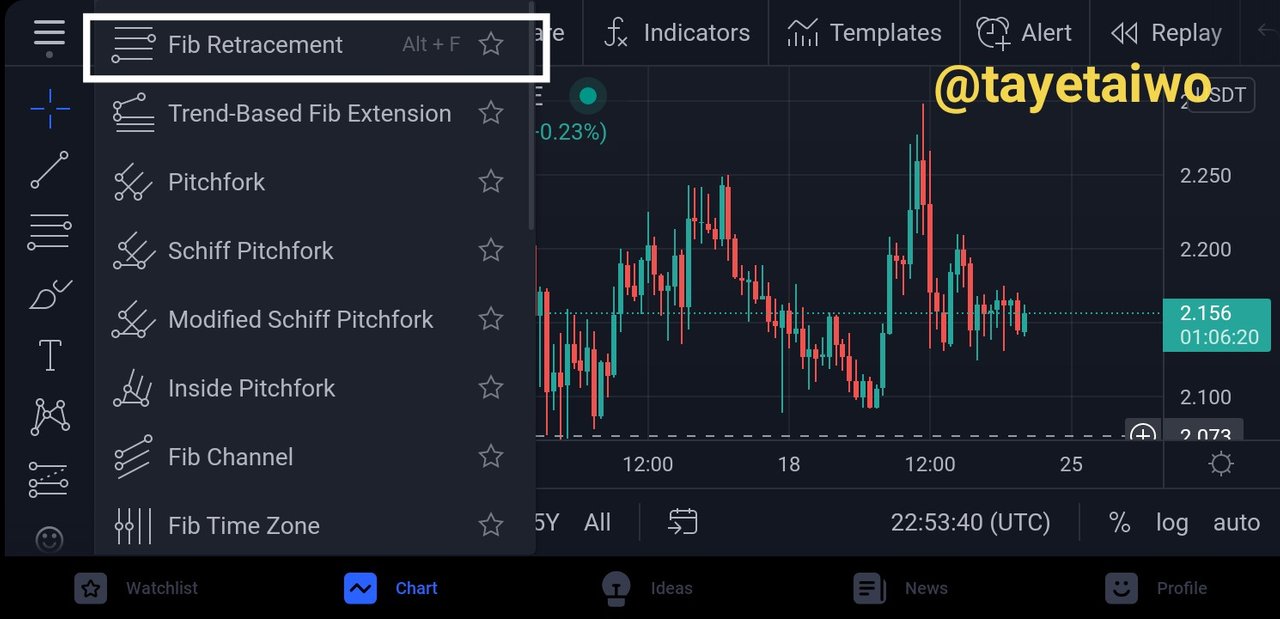
Now that the Fibonacci retracement tool has been applied, what I do is plot HH which
I use last high for on the chart, then the HL which I use last low for in the chart.

And even after 24 hours the price doesn't move as much the market marker doesn't put much liquidity and there was no big price movement (bullish or bearish) it's just consolidating.

In a situation like this where the price of the asset is consolidating, then fundamental analysis is very crucial. This will aid the traders or Investors to know the future of the coin, and make them position themselves very well
Bollinger bands are oscillator technical indicators that are used on an asset chart to show where a price is overbought or oversold, as well as to signal potential price trend reversals. This indicator calculates price divergence from an average value, assisting traders and investors in making the best trading decisions possible.

The Bollinger band is represented by a parallel line that goes over the price pattern and is comprised of three bands: the upper band, lower band, and middle band. Bollinger Bands are a type of chart that depicts how prices diverge from or intersect toward a central value.
Prices are said to be overbought when price patterns indicated by candlestick bars touch the upper Bollinger band line, indicating a trend reversal from an uptrend (bullish) to a downtrend (bearish)
When price patterns touch the lower Bollinger band, however, it indicates that prices are oversold and that a trend reversal from a downtrend (bearish) to an uptrend (bullish) is likely.
HOW BOLLINGER BANDS APPLY TO CRYPTO TECHNICAL ANALYSIS
The Bollinger band has a SMA 20 embedded in it that looks to be in the middle or between the upper and lower billing band lines, assisting the trend-following indicator's performance. Due to the increase and decline of price trends, the Bollinger band is used to monitor asset volatility.
As previously said, it consists of three lines (upper, middle and low) and aids in the identification of overbought and oversold conditions.
We tend to see and note the small swing of the Bollinger bands when the market is stable and the automatic expansion of the Bollinger bands when price volatility increases when doing technical analysis with the Bollinger band.
After each trend, the asset's prices tend to retrace closer to the middle of the Bollinger band. When prices reach the end of a Bollinger band, it is expected that they will bounce back and retrace in the other direction. As a result, the Bollinger band is a good swing trading technical indicator that aid traders make the best trading decision.
INDICATOR TO BE COMBINED WITH THE BOLLINGER BANDS
Bollinger Bands, like other indicators, can't provide 100% correct market analysis on its own.
For the purposes of answering your question, I'll use a combination of Bollinger Band and RSI analysis (Relative Strength Index).
This technical indicator is employed in financial trading analysis. This indicator is used to determine a crypto asset's historical and current strength or weakness. This indicator shows when the price is overbought or oversold, indicating whether it is bullish or bearish. It displays divergences, which can be really helpful.

The RSI operates on a scale of 0 to 100, and when combined with the Bollinger Band, it aids in the verification of the Bollinger Band's initial analysis. If an asset, for example, reaches the upper band in a Bollinger Band analysis, signaling a strong buy, confirmation is obtained when the RSI signal reaches 70% or above. This indicates that the trader is eligible to participate in the buy market. However, if the RSI is 30 or lower, the trader should be wary of believing the Bollinger Bands, since a decline may occur instead of the expected upswing.
Conclusion
When determining which asset to invest in, fundamental analysis is crucial. It aids in the detection of theft and valuable valuables. After these assets have been identified, they may be traded by an investor who wants to make frequent entries and exits. They'll need technical analysis at this point.
The study of charts to determine trends and future pricing is known as technical analysis. It is accomplished by the use of tools and strategy. When these are combined, it is most effective. The RSI and Bollinger Bands are a solid combination among the many tools available. Depending on the market structure or price trend, they can also be supplemented with a plan.
Thank you professor @imagen for this beautiful lecture
Gracias por participar en la Cuarta Temporada de la Steemit Crypto Academy.
Continua esforzandote, espero seguir corrigiendo tus asignaciones.