[Crypto Trading Using Zig Zag Indicator]- Crypto Academy /S6W1-Homework Post for kouba01
Hello steemian ...
This is my new post in the Steemit Crypto Academy community, on this season 6 week 1, I will be working on a homework from professor @kouba01 with the theme "Crypto Trading Using Zig Zag Indicator”.

we will discuss it through the homework below:

1. Show your understanding of the Zig Zag as a trading indicator and how it is calculated?
The zig-zag indicator is an indicator consisting of interconnected sectional lines. The sectional line connects the support and resistance points. These support and resistance points are the highest and lowest points so this indicator allows traders to read price movements.
the zigzag indicator filters out small price movements and the only significant movements in a market are the connecting points. Therefore, the zigzag indicator can be used to see large movements or significant changes that occur in the market.
The calculation of the zigzag indicator is based on the percentage of price movement in a certain interval, this makes the formula more logical than numerical. The formula for the zigzag indicator is as follows:

2. What are the main parameters of the Zig Zag indicator and How to configure them and is it advisable to change its default settings? (Screenshot required)
The main parameters of the Zig Zag indicator are based on historical price data that form buy and sell signals that are not necessarily permanent, that's because the indicator will automatically update its lines when price movements change and move in a new direction. On this basis, most traders do not use zig-zag lines to determine to buy and sell, but most of them tend to use them to confirm the direction of the trend.
It can be concluded, the main parameter of the zig zag indicator is about the use of percentages or low and high connecting points which are parameters to form and build lines on the indicator.
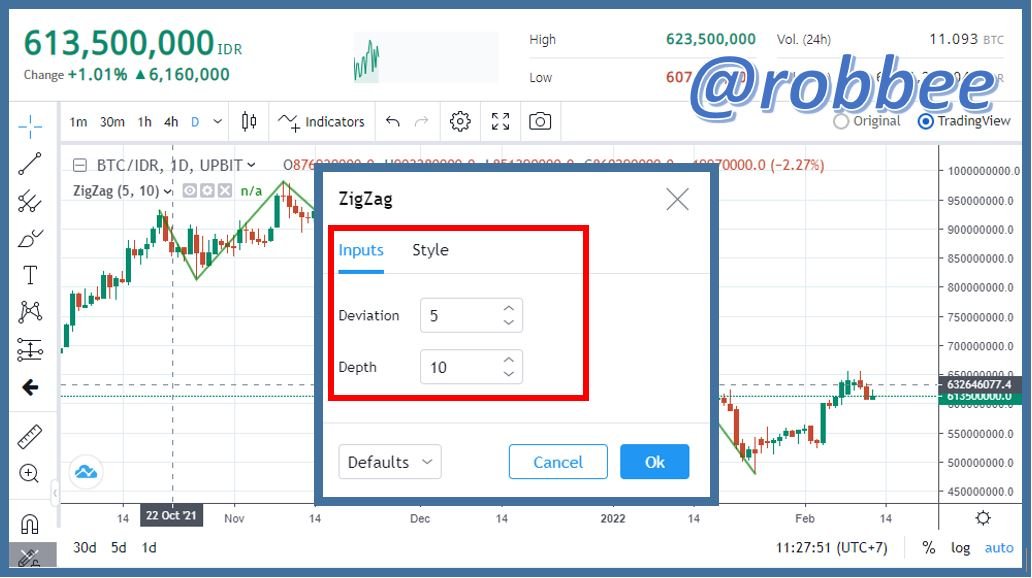
2 important parameters can be used as the basis for setting the default ZigZag indicator, namely Depth and Deviation. Dept is the first setting parameter that defines the minimum distance of the candle that has no minimum or maximum deviation, the best setting for the Depth parameter is 10. Deviation is the second setting parameter that represents the change in the market minimum price that depends on the minimum price maximum before the zig-zag indicator is formed, the best setting for the Deviation parameter is 5.
3. Based on the use of the Zig Zag indicator, how can one predict whether the trend will be bullish or bearish and determinate the buy/sell points (screenshot required)
To answer this question, I will take the example of the asset price movement of The Graph (GTR/IDR). To predict the direction of the trend, on this indicator we can do this by observing the movement of the low and high points on the zigzag indicator.

If the high point indicates a downward movement to the next high point and the low point indicates a downward movement to the next low point, this indicates that a bearish trend is occurring. Then vice versa. If the high point indicates a move to the next high point which is getting higher and the low point indicates a move to the next low point which is getting higher, then this indicates that a bullish trend is occurring. We can see the trend very easily on the zig-zag indicator because this indicator shows the trend very clearly and removes noise well.

To determine the point of buying and selling we can do it familiarly. We can buy if the candle crosses the nearest low, as shown in Buy 1. Then if the price drops but doesn't go past the nearest low, then you can sell it for safety, but if you hold it, you have more potential to make a profit, it's shown in Sell 2. If you purchase as indicated at the point Buy 2, then it is the best point because it belongs to the bullish trend zone with maximum profit. And you can cook a sell/stop-loss if conditions show a Sell 1 point, that's because the price movement has passed the nearest lowest point so it has the potential to fall freely, even though the chart above doesn't show that.
4. Explain how the Zig Zag indicator is also used to understand support/resistance levels, by analyzing its different movements.(screenshot required)
To answer this question, I will take the example of the asset price movement FLOW (FLOW/IDR). To understand the support/resistance levels on the Zig Zag indicator, we can understand them better because the Zig Zag indicator will display the support/resistance levels well and remove a lot of annoying noise.

The image above shows the resistance level marked with the high point in the green box. This is evidenced that after the price touched the high point and fell, the price went back up to the previous high point level. Likewise, with the support level, it is marked with a low point in the red box. this is evidenced that after the price touched the red dot and rose, the price went back up to the level of the previous low and this became the limit for the price not to be much lower.
Then, from the picture above we can also group support and resistance points in a more general scope as shown below:

From the picture above, we can predict after seeing the points of support and resistance levels are so clear. The majority of prices that form several resistance levels can be combined into 2 resistance points and several support levels can be combined into a support level, price movements and reversals after reaching the support level are very clear.
5. How can we determine different points using Zig Zag and CCI indicators in Intraday Trading Strategy? Explain this based on a clear examples. (Screenshot required))
For the Intraday trading strategy, I will use a 1-hour TimeFrame and set the default CCI indicator with a length of 20. In using the Zig Zag indicator, we can do the usual strategy, which is to buy when the price is at the support point which will experience a bullish trend.

Then, we use the CCI indicator as a signal to confirm the momentum which proves that I bought when the market was oversold and this means a buy signal. For the time to sell/Take Profit, we can sell when the Zig-Zag indicator identifies that a bullish trend is occurring.
Then, we use the CCI indicator as a signal to confirm the momentum which proves that I sell when the market is overbought and this means a Sell signal.
6. Is there a need to pair another indicator to make this indicator work better as a filter and help get rid of false signals? Give more than one example (indicator) to support your answer. (screenshot required)
In my opinion, it is very necessary to add another indicator along with the zig zag indicator. As we know that the zig zag indicator works well in identifying trends but is not good at providing trade entry or exit signals. In this case I like to add the Bollinger Bands and CCI indicators along with the Zig-Zag indicator.

Based on the screenshot above, we can use the Zig Zag indicator to buy when the price is at a support point which will experience a bullish trend. But that's not enough, in making a purchase, we have to make sure that the CCI indicator shows a line that is below 0 which means the market is overbought. Then for more accurate results, we must ensure that the bollinger band indicator shows a candle that touches or exits from the lower band which confirms the market is overbought, then this is an ideal market entry or buy strategy.
On the other hand, we can use the Zig Zag indicator for selling or exiting the trade when the price is at the highest resistance point (you can do that before but you have to get support from the other 2 indicators). in making a purchase, we must ensure that the CCI indicator shows a state of the line that is above 100 which means the market is oversold. Then for more accurate results, we must ensure that the bollinger band indicator shows a candle that touches or exits from the upper band which confirms the market is oversold, then this is an ideal market exit strategy.
7. List the advantages and disadvantages of the Zig Zag indicator.
There are several advantages and disadvantages to the Zig Zag indicator:
Advantages :
- This indicator is good for identifying market trends. With charts that only show charts with significant price movements.
- Able to filter noise well so that reading price movements become easier.
- It beginners is not too difficult to use this indicator because of its simple use.
- that is Good to use for high timeframe trading.
- When combined with other indicators such as Bollinger Bands, it will be more efficient and accurate.
Disadvantages :
- Not suitable for predicting the market because the line is often repainted based on historical data of previous price movements which can cause traders to get false swings.
- Not suitable for traders who have a short-term trading style.
- that is not very reliable if you don't combine it with other indicators.
8. Conclusion
The Zig Zag Indicator is an easy-to-use indicator and is likely to be used by beginners too. The Zig Zag indicator is very good at filtering noise so that it displays clear charts and identifies trends. But as we know this indicator is good to use in identifying market trends, while to find out entry and exit points, this indicator is recommended to be used in conjunction with other indicators for example the Bollinger band. For that, it takes good experience to use this indicator in setting market entry and exit times.
Reference