Crypto Academy Season 4 week 2 Crypto Trading With Volume Indicator by professor @kouba01

Explain the volume indicator in your own words.
Trading with volume is very important as it can be used by traders to verify trend strength and weakness to some new traders in the trading field trading volume could be a less significant tool when analyzing market trends, although like most indicators require other indicators for more clarity and confirmation the volume tool/indicator need to work with another subsequent tool to give traders more confirmation on market entry.
In general trading volume is used to measure how much a given crypto market has been traded in a given period it could be on a 4H timeframe or a daily timeframe depending on a trader's trading strategy they can choose to modify their trading volume indicator.
In most trading platforms or exchanges trading volume can be indicated using a vertical chart bars green chart indicates buying pressure in the market or the bulls are in charge of the market while a red volume chart represents a selling pressure the strength and weakness of the chart can be represented by the length of a vertical chart if the chart is green and very lengthy and the following subsequent chart is also lengthy and green it shows the market trend is very strong.
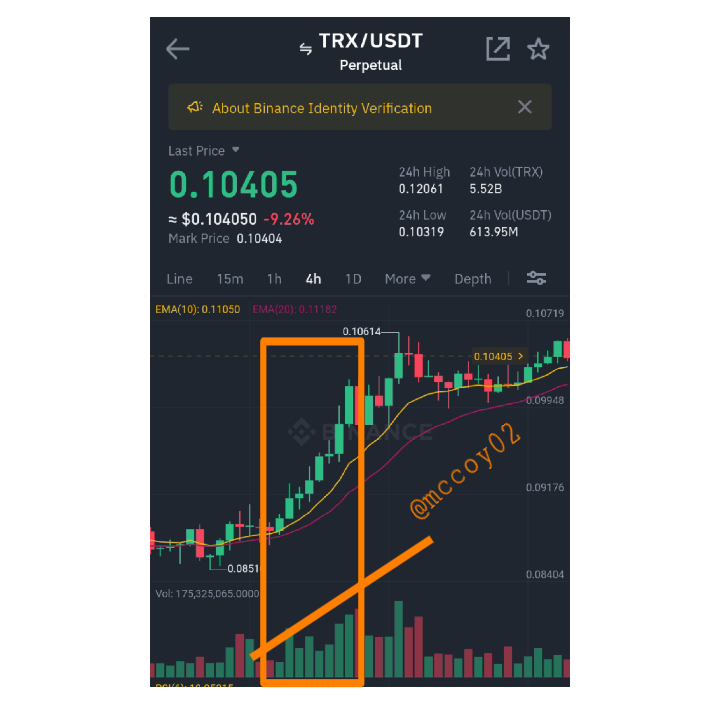
The chart below shows a 4H timeframe of TRX/USDT it can be obtained from the chart below the traded volume increased which can be seen to reflect on the price of TRX as the volume increases we also see how the price move upward.
The chart below also shows a weak volume chart indicating selling pressure it shows the sellers are dominating the market it can be observed as the market falls the volume indicator also increases when the market begins to recover we can see how the volume indicators will be reduced in size.

Therefore in general the volume indicators are technical tools used by traders to measure the volume of traded assets within a specific period it can be used for knowing the market strength and weaknesses in terms of buying and selling pressure of an asset which are represented in a vertical chart

Use a platform other than Tradingview to present the volume indicator on a chart and show how to configure its parameters by justifying your choices. (Screenshot required)
Since I'm not using my binance on web browser I will be using **Meta4 trading application to show how to configure volume indicator.
Open meta4 trading app and access given currency of choice I will be using AUD/CHF on 4h timeframe.
Select open chart to have access to AUD/CHF trading overview.

- Click on the f sign to have access to the platform indicators.

- I will be selecting the volume from the drop-down indicator list.

- Below is the view of the volume indicator with its configuration I will select done.

- Below is the overview of the trading volume indicator on the Meta4 trading application.

What is the link between Volume and Trend and How to use volume to predict a trend reversal? (Screenshot required)
Trading volume is used to show price momentum in every crypto asset price movement are very important they are often used by traders to know the direction of an asset, in general, it can be obtained/observed that trend and volume works simultaneously which means as the volume of a particular asset increases we can also observe an increase in such asset price trend.
A typical example is when a trader wishes to open a trading position after conducting his technical analysis he would now check on how the asset volume has been moving related to the price trend if he observed a simultaneous correlation between the volume and price he can choose to open a position depending on how large the volume pressure is.
In essence, it can be said trend and volume in trading, works simultaneously and gives a trader confirmation on where an asset is heading either an upward or downward trend.
On the other hand the volume can be used to confirm a price reversal.
Here a trading volume price reversal can be due to when the trading volume and price has no relationship this means for an asset be showing a strong trend while the volume is indicating a weak signal when this is observed we can say there is likely a price reversal about to happen in the market.
The chart below shows a typical example of **price reversal as can be seen the yellow circle shows an increase in the price trend of TRX but the pink circle shows a decrease in volume and a price reversal quickly followed.

This means there is no relationship between the volume and price
How to use the volume to have a signal confirmation? (Screenshot required)
Using support and resistance to confirm volume price signal
Support line
Volume can be used to confirm a support line trend here when an asset breakout with a high volume increase in an upward price movement by breaking the support line further down we can say there is weak buying pressure from buyers which can signal a further downtrend movement in the price of an asset.
The chart below shows ETH/BUSD 4h chart it can be obtained from the chart the volume made an increase following a downtrend that break the support line which a new uptrend followed immediately.

Resistance line
The chart below shows an increase in volume that broke the resistance line this signals a strong price movement in an upward direction the increase in volume shows a trader a signal for strong price movement.

How does the volume reflect the evolution of prices in the charts and why does the volume sometimes anticipate the price? (Screenshot required)
As I've stated earlier relationship between price trend and volume should go simultaneously for traders to have real price confirmation entry of any asset.
How does the volume reflect the evolution of prices in the charts
Since the trend and volume work for for for for hand in hand, it can be said that volume action reflects the price trend of an asset.
For an upward price movement it can be observed as the volume increases the demand for that particular asset also increases this increase shows there is a buying pressure in the market which also indicates an increase in the price action of such particular asset.
Below is an example showing how an increase in volume reflects on the price of BTC.

Also for a downward price movement it can be said as the volume increases with a selling pressure there will be a continuous decline in the price of an asset the more the supply the lower the demand here sellers are dominant in the market by selling off their asset the volume for selling pressure will increase and on the price it will be reflected with a downward price movement.
Below is an example as the selling pressure in volume increases we will experience a price reflect in a downtrend.

Why does the volume sometimes anticipate the price?
Since the volume can be used simultaneously to reflect price action it can therefore be used to anticipate the price of an asset.
As the volume increase, we also observe an increase in price as it decreases with selling volume we experience a price decrease.
Is it better to use the volume indicator alone or use it in parallel with another indicator when trading? Justify your answer
In trading most traders like defining their trading strategy since we have multiple indicators that can be used for trading there is always a need to combine these indicators this will help a trader have more clarity and confirmation on a trade entry.
Trading with just a volume indicator is not the best therefore supporting it with another indicator can be very useful and more efficient.
Using Relative strength index (RSI) with volume indicator will be very useful for trade confirmation.
The RSI is an important indicator that can be used to determine the strengths and weaknesses of buying and selling pressure in a market trend.
The RSI has a range value from 1-100 if the RSI reading is below 50 it indicates a selling pressure from sellers while a reading above 50 indicates a buying pressure.
Therefore with the help/support of RSI, a trader can easily understand who is dominating a market either from the buyers or sellers, integrating both tools will help give a trader more confirmation.
Take for instance when an RSI read above 50 it shows a trader the buying pressure is high when it correlates with volume making the volume also increase as RSI increases a trader can therefore be certain a price movement in an uptrend will be expected.

The chart above shows an RSI above 50 which indicates a buying pressure it can also be seen how the volume increased as the RSI maintain a range above 50 this was also reflected in the asset price.
The volume indicators are multiple, choose one of them to briefly explain its usefulness in crypto trading.
I will be explaining the volume indicator.
The graph represented above is a typical example of a volume indicator.
It is represented by vertical column bars arrange in a random ascending and descending order the vertical lines are used to represent the strength and weakness of price action.
The green vertical bars represent an uptrend price movement.
The red vertical bar represents a downtrend price movement.
The length of a vertical bar represent the strength of particular price action if the bar is high it shows there have been either strong sell or buy pressure depending on where the price was headed.
*If the price was on an uptrend the vertical bar will be green and vise verse.
Usefulness of volume indicator
The volume indicator is used to represent how price action in trade is measured.
With the help of bar strength and weakness a trader can confirm where price action is moving towards
The volume indicator with another trading indicator can be used to make a good market entry on a trade
It can be used to determine the increase and decrease of price action in a trade.
Conclusion
Trading with volume indicators is very important in trade as it can be used by traders to measure the strength/weakness of a price movement the volume indicator is very useful when integrated with other trading tools like the RSI or MA.
It can also be obtained the volume indicator is used to know the strength and weakness of a price demand and supply can also be determined by volume increase or decrease.
Hello @mccoy02,
Thank you for participating in the 2nd Week Crypto Course in its 4th season and for your efforts to complete the suggested tasks, you deserve a Total|3.5/10 rating, according to the following scale:
My review :
An article with under-average content that lacks a clear methodology in answering the questions, which leads to the absence of good analysis and interpretation of the elements required to be clarified. There is also a misunderstanding of some questions, such as the last question that asked you to provide an indicator other than volume and it belongs to the same family, not to re-describe the same indicator.
Thanks again for your effort, and we look forward to reading your next work.
Sincerely,@kouba01