SteemitCryptoAcademy-Bitcoin and Crypto Markets Analysis - May 31, 2025 - Navigating Correction Zones: Bitcoin's Path to New Highs

Hello steemians,
By carefully observing the chart I shared, I notice that Bitcoin is evolving in a long-term bullish dynamic, characterized by a succession of ever higher lows and highs, which confirms the strength of the ascending trendline visible on the chart, this trendline, which has been tested and respected several times, acts in my eyes as a fundamental dynamic support which supports investor confidence and the consistency of the price trajectory since the low point observed around 15000–20000USD in mid-2022.
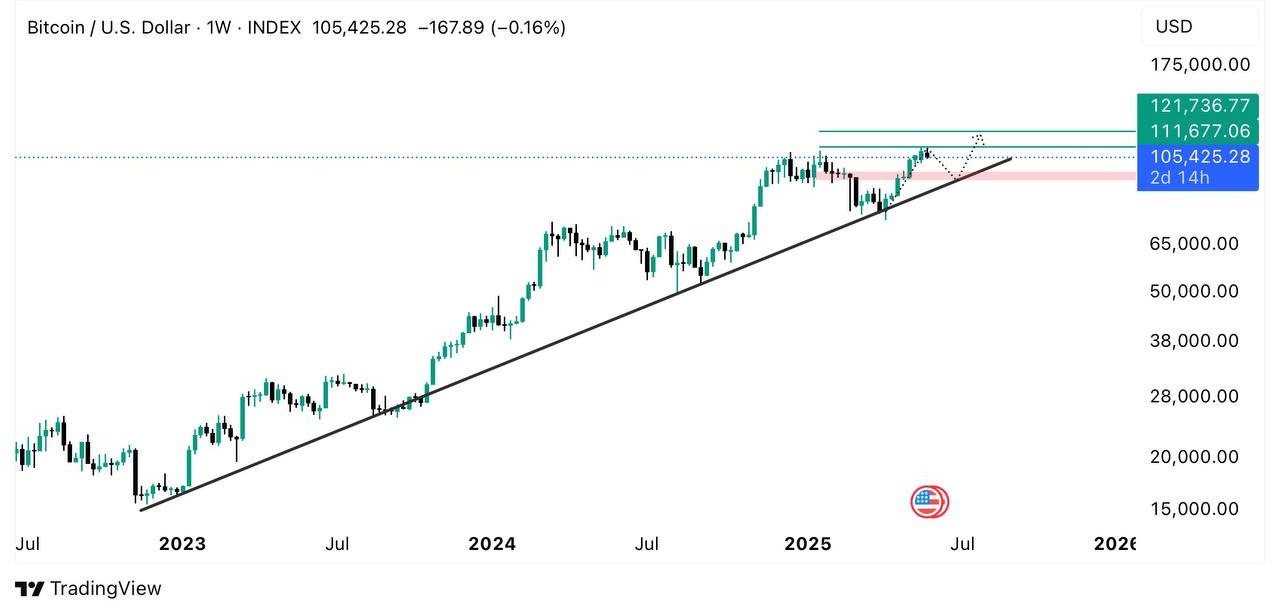
Currently, Bitcoin is around 105425USD, a level which, according to my analysis, marks a technical resistance zone located between 105000USD and 111000USD, this zone represents, in my opinion, a natural level where profit-taking multiplies, and where the most cautious buyers wait for additional technical confirmations before strengthening their positions, just above, the chart indicates a second clear bullish objective around 121736USD, an objective which corresponds to the natural extension of the bullish impulse already initiated and which could constitute a major psychological threshold if Bitcoin manages to break through the previous resistance zone.
However, I am convinced that financial markets, even in such a strong bullish dynamic always need correction phases to maintain balance and avoid excesses. In this regard, the red shaded area, identified between 95,000USD and 100,000USD, appears on the chart as a key support zone and potential correction with a temporary return of prices to this zone would not, in my opinion, be a sign of structural weakness but rather a logical and salutary technical adjustment, allowing the market to "breathe" and consolidate recent gains before a possible bullish revival.
For my part, I consider that this possible correction towards the 95000–100000USD area would be a healthy scenario and perfectly natural for an asset in full expansion, and that it would even offer strategic buying opportunities for those who wish to enter the market at more attractive levels. I remain convinced that as long as the ascending trendline remains intact, the overall momentum remains bullish: a rebound from the red zone would strengthen the conviction of buyers and consolidate the prospect of a continuation of the rise towards higher levels, notably 111000USD, then 121736USD.
I add to this that I will be closely monitoring certain key technical indicators such as trading volumes, the RSI and the MACD, which could give me additional signals of the resumption of the upward momentum or, on the contrary, of the caution to be adopted if the volumes were to run out of steam. For me, the evolution of these indicators will be decisive in confirming that the potential rebound is not just a simple temporary surge, but rather the confirmation of a solid and lasting recovery.
In conclusion, I think that the chart I shared suggests a healthy correction scenario towards the 95000–100000USD area, before a resumption of the bullish momentum towards the resistances of 111000USD and 121736USD, I therefore remain confident in the continuation of the long-term bullish trend, as long as the trend line remains respected and the trading volumes and technical indicators confirm the strength of the buyers, for me, this scenario is in line with the evolution that Bitcoin has experienced since 2022, and it opens up interesting prospects for the future, especially if the market manages to cross the identified psychological thresholds and maintain the confidence of market players.
Warm regards,
@kouba01 (Steem Representative)

Wow, very informative! 📈 Could you share some extra tips on how to get more upvotes on Steem posts?