SteemitCryptoAcademy-Bitcoin and Crypto Markets Analysis - May 18, 2025 -Crypto Market Tension Zone: Bitcoin and Ethereum Key Levels Study
Hello steemians,
🔶 Bitcoin Analysis (Bitcoin / USDT – 4-hour timeframe)
The first chart shows that Bitcoin is currently trading in a range after a strong bullish wave that began in mid-April. This horizontal oscillation reflects a state of hesitation in the market, with buyers taking profits while maintaining positive momentum in the overall trend. The price fluctuates between two clear areas: a strong horizontal resistance at $104,446 and a dynamic support represented by the 200-period simple moving average (green line), which is currently near $100,282.
What is striking is that the price takes a technical form resembling a "cup and handle" pattern, a bullish reversal pattern that usually appears after a clear uptrend, this pattern shows that there is a gradual accumulation by investors in preparation for a further breakout to the upside, this pattern is completed if the price retests the lower boundary of the sideways range, forming a small handle, before starting to break through the resistance.
However, it is important to note that true confirmation of the start of a new strong upward wave will only come with a full weekly candlestick close above $104,446, this level represents the bottleneck that separates the current period of volatility from the resumption of the uptrend, if this threshold is reached, the next potential targets will be $106,000 and then $108,000, with the possibility of reaching new all-time highs later if the buying momentum continues, and conversely, any break below the 100,000 level could push the price towards lower support areas, potentially threatening this bullish scenario, therefore, the interaction with the moving average should be closely monitored in the coming days.
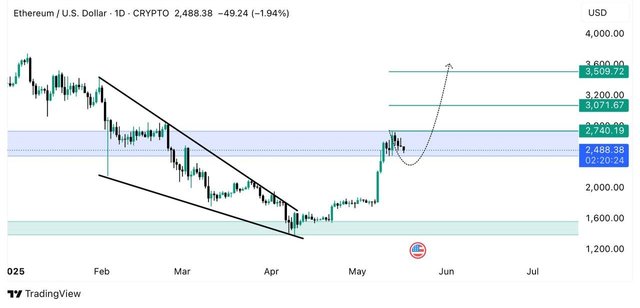
🔶 Ethereum Analysis (Ethereum/USD – Daily Timeframe)
Moving on to Ethereum, we can see on the daily chart that the currency has strongly broken out of a bearish technical pattern known as a “falling wedge”, a pattern that is inherently bullish if broken from above, as is the case here, the positive breakout in early May was followed by a rapid surge in price, as Ethereum broke out above a key resistance area that had been a price ceiling for several weeks.
The price is currently trading around $2,488, having reached a local high of $2,740, thus reaching the first target after the breakout. Meanwhile, the price remains in a consolidation range within a support zone between $2,400 and $2,500 (highlighted in blue). Price stability in this area is a good sign that the market is consolidating for further upward movement.
If the price continues to stabilize above this area without breaking it, we expect a further upward movement that could initially target $2,740, followed by $3,071, and possibly $3,509 in the medium term, these levels represent key technical milestones along the upward trajectory and may experience some hesitation or brief corrections before continuing, however, on the risk side, any decisive break of the blue support zone and a daily close below it could send Ethereum back to test the $2,200 or even $2,000 levels, which could weaken the current positive momentum, the key point is that the overall trend is still upwards and the momentum is clear, however, the continuation of the positive movement depends on the price's ability to hold its established zones and not abandon them.
🔶 General Technical Summary
Bitcoin is currently in a critical phase of technical consolidation, a break above $104,446 would be a strong signal for a further upward push, especially if it occurs on a weekly chart, on the other hand, its continued fluctuation below this level does not necessarily portend a decline, but rather reflects further consolidation that may translate into further momentum, as for Ethereum, it has already shown strong technical signals by breaking the falling wedge pattern and successfully reaching two price targets, its current stability above the blue support zone reinforces the hypothesis of targeting the levels of $3,000 and above, however, the lack of consolidation in this area could change the dynamics, therefore close monitoring of price action remains essential to confirm trends.
Warm regards,
@kouba01 (Steem Representative)


@tipu curate
;) Holisss...
--
This is a manual curation from the @tipU Curation Project.
Upvoted 👌 (Mana: 7/8) Get profit votes with @tipU :)
Please also organise some contest in crypto academy.. i am very missing that slc contest
Good
Congratulations!! Your post has been upvoted through steemcurator04. We encourage you to publish creative and quality content.
Curated By: @miftahulrizky