Crypto Academy / Season 3 / Week 3 - Homework Post for @cryptokraze


OVERVIEW
Hello there and welcome to the uncertain world of crypto trading. Here you have to do your own diligent analysis or you're literally gonna pay for it.
It goes without saying that crypto trading can be a very messy business, especially if you're still struggling with making correct technical analysis.
Now, one of the sore sights you might see is something that looks like a market reversal but in reality, it's not.
Well, if you don't know what a market reversal is, it's something that happens in a trending market where the trend reverses in the opposite direction (for the sake of this post, I may not break it down further than that).
This post talks about when the false market reversal is actually a trend continuation and how to navigate through such periods in crypto trading without rounding up into the wind or outrightly bleeding coins
BREAK RETEST BREAK STRATEGY
I figured out that mentioning this trading strategy might give a clear hint on what trend continuation is.
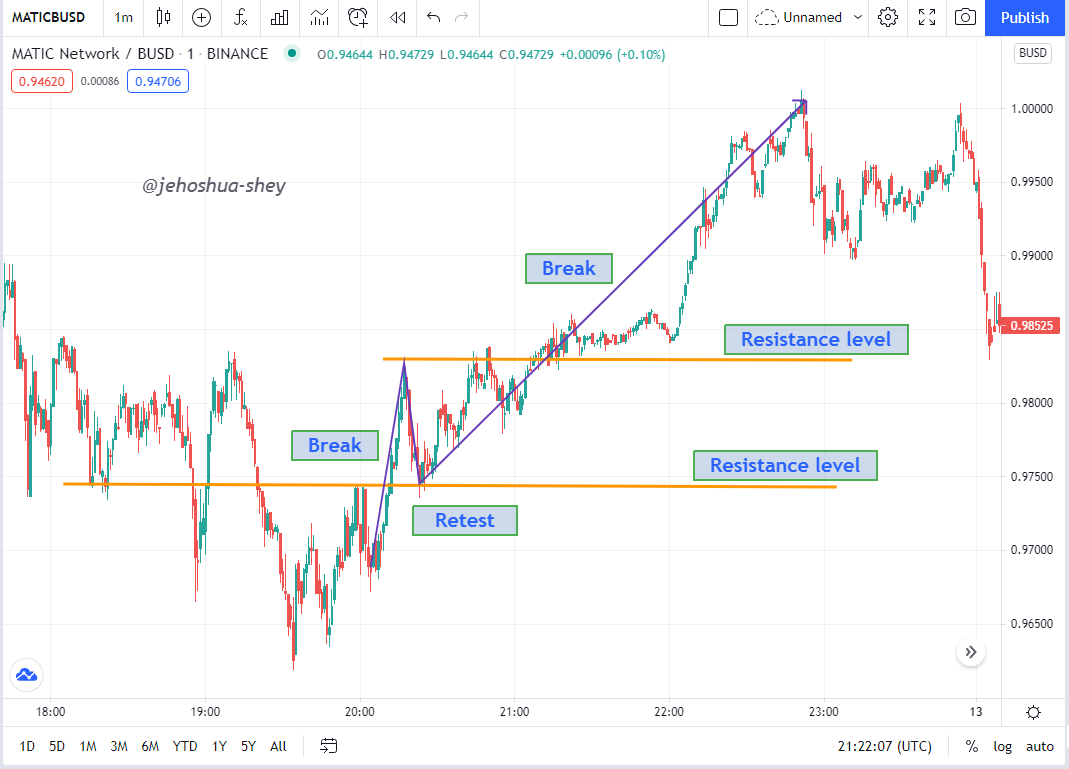
Now, when in a trending market, we see cases of price breakouts but sometimes it gets to a point where the price movement tends to retest or return to the previous resistance level (for bullish trends) or previous support level (bearish trends). After retesting the resistance/support level, the price breaks out again, breaking the newly formed resistance/support and creating a higher high/lower low respectively.
Bullish Trends
For bullish trends, the price spikes above the resistance level on the chart but seem to slump back to the resistance level making it look like a market reversal until...
The price spikes again with another breakout above the new resistance level.
See the image below for a typical example of this bullish trend continuation aka Break Retest Break chart pattern on a MATIC/BUSD 1m chart.
Bearish Trends
For bearish trends, the price falls below the support level on the chart but seems to rise back to the support level making it look like a market reversal until...
The price falls again with another breakout below the new support level.
See the image below for a typical example of this bearish trend continuation aka Break Retest Break chart pattern on a MATIC/BUSD 1m chart.

IMPORTANT LEVELS ON THE CHART WHEN USING BRB STRATEGY
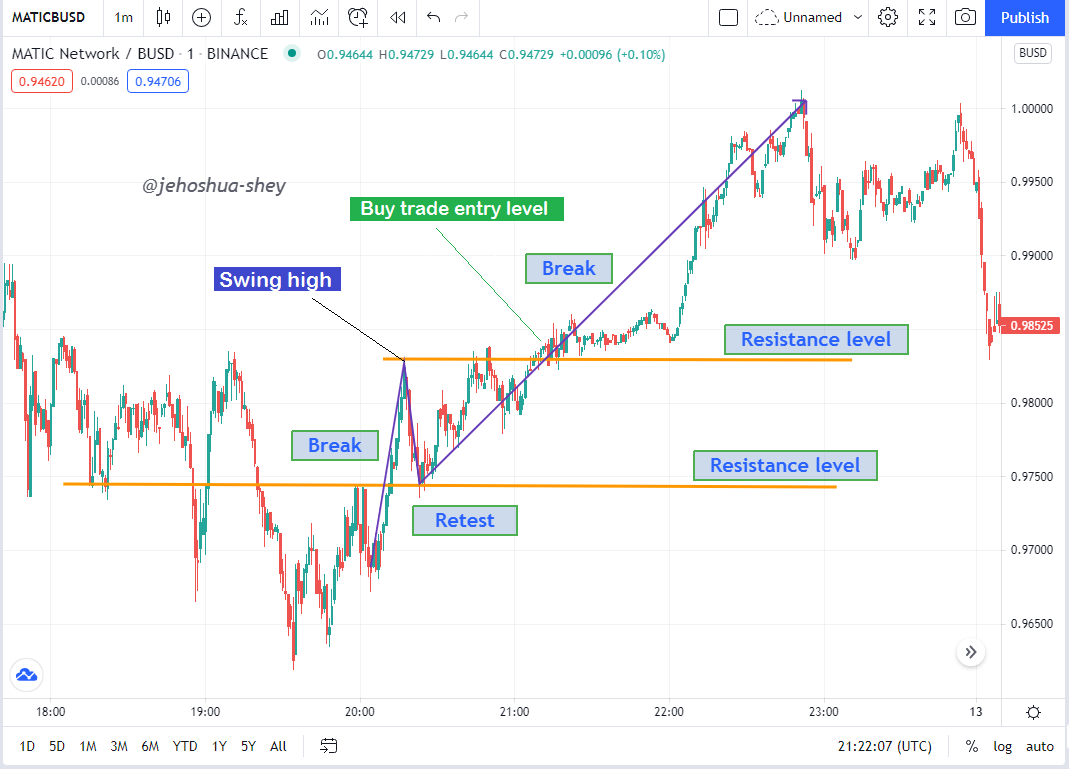
Now you know what a trend continuation and the break retest break strategy is all about, let me show some key points on the chart for both buy and sell scenario
Buy Scenario

Sell Scenario

From the above images, you can see that I added 3 more points to each chart. One entry and two exits point for both the buy and sell scenarios. These points are
Entry point: The point at which we enter the trade, whether it's a buy or a sell trade
Exit point (take profit): This is the point we exit the trade when it is going in our favour
Exit point (stoploss): This is the point we exit the trade when it is not going in our favour.
TRADE ENTRY AND EXIT CRITERIA
Now let's talk about entering and exiting the market during trend continuation patterns.
Trade entry for Buy trade
Once we suspect a trend continuation or break retest break pattern, this is how to make a buy trade entry
Observe the market price movement, if it's truly a break retest break pattern, the market price will first be getting close to a resistance level. Take note of this resistance level.
Your suspicion about the market pattern won't be confirmed until at least, the resistance level is broken and the market forms a new swing high. Patiently wait for this to happen.
When the break-out happens, the pattern is not yet confirmed. Wait till the market price slumps to or retests the resistance level (note that it mustn't necessarily touch the resistance level but it should get significantly close).
After retesting the resistance level, the price should continue back upwards and break the new swing high formed after the first break-out.
When this happens, you can be quite sure it's most likely a break retest break pattern.
Now place your buy trade entry a little above the swing high that was broken after the retest.
Trade entry for Sell trade
Once we suspect a trend continuation or break retest break pattern, this is how to make a sell trade entry
Observe the market price movement, if it's truly a break retest break pattern, the market price will first be getting close to a support level. Take note of this support level.
Your suspicion about the market pattern won't be confirmed until at least, the support level is broken and the market forms a new swing low. Patiently wait for this to happen.
When it happens, the pattern is not yet confirmed. Wait till the market price rises back to or retests the support level (note that it mustn't necessarily touch the support level but it should get significantly close).
After retesting the support level, the price should continue back downwards and break the new swing low formed.
When this happens, you can be quite sure it's most likely a break retest break pattern.
Now place your sell trade entry a little below the swing low that was broken after the retest.

Trade exit for buy trade
After we have entered the market, there are two ways we can exit the trade.
Stoploss: When the market goes against us, we set a maximum loss allowance beyond which we cannot afford to lose any further. For a buy trade, the stoploss should be set a little below the resistance level that was retested.
Take profit: When the market goes in our favour, we can't afford to be greedy. There's a point at which we should exit the trade and secure the profits realized up till that point.
Setting our take profit is related to where we set our stoploss. This is because of a factor called R:R (risk to reward ratio). In this course, it was advised that we use a 1:1 (R:R) ratio. This means that the difference between our stoploss and entry point must the same with the difference between our take profit and entry point.
Buy trade exit
Trade exit for sell trade
Here, we're in a situation where we've already sold an asset but we need to buy it back. This may be because we're optimistic there will be bull run soon and we want to acquire the asset in more quantity.
There's a second situation where a sell trade exit is practical in normal crypto spot trading and that's in steem power up. Suppose I have 2000 steem, but I want to have up to 3000 to increase my chances of winning August SPUD4STEEM. If I notice a break retest break in any steem pair, it's a chance to increase the amount of my steem. I'll sell the steem and wait for the price to dip lower so that I can buy more.
Assuming it was STEEM / USDT and I sold 2000 STEEM @ $0.45, I now have
2000 x 0.45 = $900
Then, if I'm right and it's a break retest break pattern, depending on my R:R ratio, I can buy back STEEM probably @ $0.3, then I would now have
$900 / $0.3 = 3000 STEEM.
So, with the help of break retest break strategy, I have increased my STEEM from 2000 to 3000, without investing a dime more.
Now we understand how to increase our STEEM for the next power-up, let's see how to exit the sell trade (buy back your STEEM). Remember we have two exits in a trade.
Stoploss: For exiting a sell trade, we set our stoploss just above the support level the price retested.
Take profit: For the sake of this course, we're constrained to 1:1 risk to reward ratio so, set your take profit at a point such that:
Stoploss - Entry point = Entry - Take profit
Sell trade exit
TRADING WITH BREAK RETEST BREAK STRATEGY
Now finding an application for this strategy is literally not a day job. However, when you finally find, the strategy is usually as sure as you are to get upvoted when you score 5 and above in the steemit crypto academy.
I did find some applications for this strategy on the 30min timeframe and I traded on binance. I'll however be showing the chart from trading view.
COTI/USDT
The first application I found. I entered a buy trade at 0.12617 and took profit at 0.12664. My stoploss which was never used was set at 0.12570. My R:R (risk to reward ratio) was 1:1


Stoploss and take profit was set with OCO on binance.

The trade ended in profit after some minutes.


MANA/USDT
The second application I found. I entered a buy trade at 0.678 and took profit at 0.701. My stoploss which was never used was set at 0.655. My R:R (risk to reward ratio) was 1:1


Stoploss and take profit was set with OCO on binance.

The trade ended in profit after some minutes.


CONCLUSION
Perhaps one strategy that is effective on its own, break retest break is a seasonal kind of strategy as it is applied during a specific chart pattern. It might still need to be augmented with indicators like RSI or ichimkou as it might be tricky sometimes. Overall, it is a very efficient strategy, so efficient that it can be used to profitably trade margins and derivatives.
Thanks for reading.
Cc:
@cryptokraze
I believe that BITCOIN could still drop close to its old maximum and that is close to $ 20,000
Hmm. Why do you say so? @stefano.massari
The markets have been weak for a few weeks, this means that BITCOIN may continue to not react and go down again ... but I'm not worried. BITCOIN always does this, in the end it always goes back and always amazes us
Oh, I see. Thanks for sharing your opinion. I really appreciate it.
Dear @jehoshua-shey
Thank you for participating in Steemit Crypto Academy Season 03 and making efforts to complete the homework task. You got 7/10 Grade Points according to the following Scale;
Key Notes:
We appreciate your efforts in Crypto academy and look forward for your next homework tasks.
Regards
@cryptokraze