Crypto Academy Season 2 Week 6 - Homework Post for @kouba01
Hi Prof @kouba01, here is my homework post.
What is the MACD indicator simply?
MACD is a technical momentum indicator used in the technical analysis of assets to find trends based on the price of an asset.
Gerald Appel in the 1970s created MACD then in 1986, Thomas Asprey added the histogram feature to Gerald Appel’s MACD. It is the short form of momentum average convergence/divergence.
MACD shows the strength, direction, momentum, and duration of a trend in the price movement of an asset. It does this by studying the momentum in the asset’s price using past data to show the movement of a trend and generates signals after the analysis.
Is the MACD Indicator Good for Trading Cryptocurrencies?
Nothing in this world is absolute and MACD is not left out. Despite that, it is still a good indicator. In this highly volatile cryptocurrency market, MACD can be used to find trends in the price movement of a cryptocurrency. And with this trend, potential trading opportunities can be spotted. It may be an even more powerful tool if combined with other trading tools or indicators like RSI.
Which is better, MACD or RSI?
Our previous lecture was about Relative Strength Index (RSI). RSI is also a momentum oscillator that determines whether an asset is overbought or oversold for a potential price reversal. MACD gives the idea of a trend by measuring the relationship between two moving averages of an asset’s price.
The MACD determines the relationship between two EMAs, while the RSI determines price change in relation to recent price highs and lows. MACD gives signals based on MACD line and Signal line whiles RSI uses oversold and overbought regions to give signals. In RSI, signals may remain in the overbought or oversold regions for too long even when the price of an asset keeps rising which may give rise to false signals, but the use of the divergence of a signal line and MACD line can help spot strong trends.
I think the best can be gotten out of them if they are coupled and used together, they can help in spotting false signals.
How to add the MACD indicator to the chart, what are its settings, and ways to benefit from them?
I will be using TradingView to show how to add and configure MACD in a chart.
• First search for TradingView on google then click on TradingView to access their page.

• Find and click on Chart on the page.

• Wait for the chart to load then click on fx to show the indicator and strategies dialog box. Search for MACD in the search box. Then click on MACD and it will be shown below the main chart immediately.

After the MACD indicator has been added successfully move the mouse to the spot where MACD has been written to show its menu. Then click on the Settings symbol to show the MACD settings dialog box as shown below.

In the input settings menu, you can find fast length, slow length, sources, etc.
Fast length
Fast length in the input menu gives the time period of the shorter term EMA. It is set at 12days as default.
Slow length
At default it is 28days and it gives the time period of the longer-term EMA.
Source
Source is used to give what data from each bar to be used in the calculations. At default, it is set at close.
Signal smoothing
It determines the time period for the EMA of the MACD line. By default, it is set at 9days.

In the style menu, other settings can be seen as well. The visibility and color of the Histogram, MACD, Signal can be set in this menu.
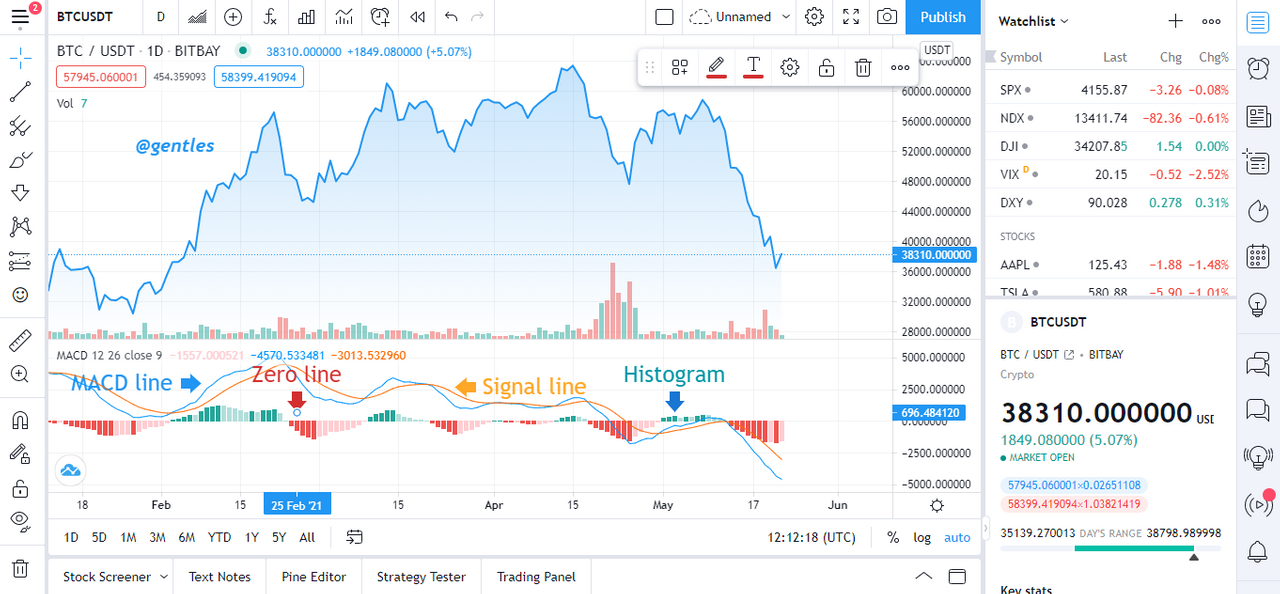
It can be seen from the chart that there are two lines present in the MACD (MACD line and Signal line). The MACD is blue and the yellow is the signal line.
MACD line.
MACD line determines the difference between two moving averages which are mostly EMAs.it is the measure of the difference between 12-period EMA and 26-period EMA. It is the faster-moving average. Mathematically, MACD= 12period EMA – 26period EMA.
Signal line
It is the slower moving average of the MACD line. Mathematically, Signal line = 9EMA of MACD line. 9 period moving average is the default of the signal line and the formula will change to the preferred number if the default is changed.
Histogram
The histogram gives in a graph form the distance between the MACD line and the signal line. It can give a signal for a potential crossover. It is also able to spot weak trends and price reversals.
Zero line
It detects price reversals. It serves as the mid-point of the histogram. The histogram moves closer to the zero line to indicate trend reversals.
How to use MACD with crossing MACD line and signal line?
When the MACD line crosses below the signal line it gives a bearish reversal. This indicates a sell signal and a downward reversal. This is illustrated below.

The chart below shows a bullish reversal where the MACD line crosses above the signal line to show an upward shift in momentum. This gives a buy signal.
How to use the MACD with the crossing of the zero line?
When the MACD crosses above the zero line, it shows a bullish which indicates a buy signal and also price reversal to the upside.

When the MACD crosses below the zero line it shows a bearish which indicates a sell signal.

How to detect a trend using the MACD?
If after a cross of the MACD line above the signal line and the MACD line diverges away from the signal line. It indicates a strong bullish trend.
And when the MACD line converges to the signal line it shows a bearish trend.
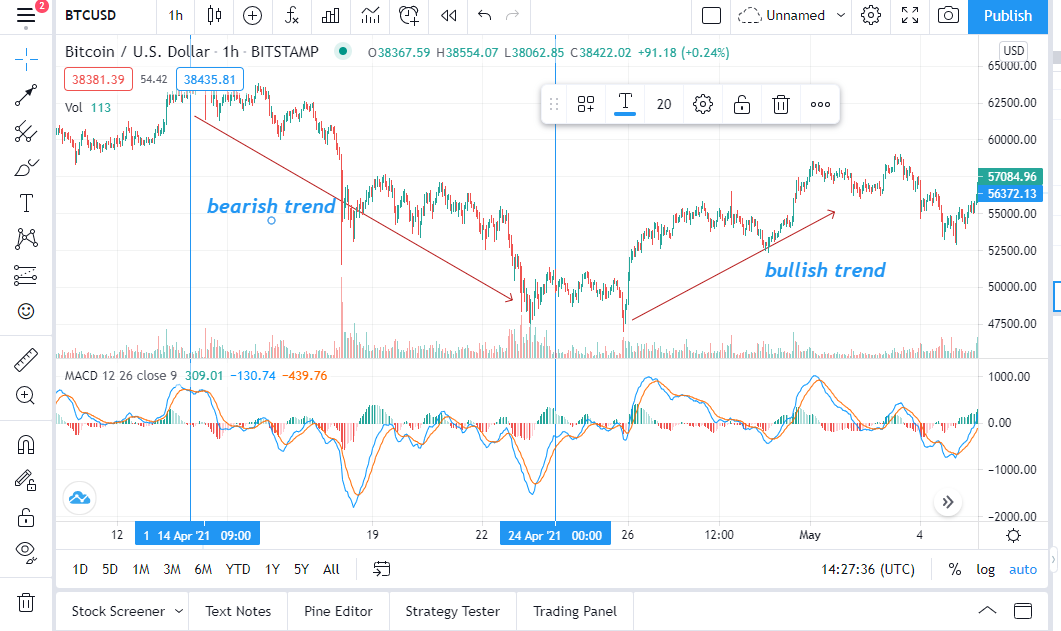
The histogram can also be used to determine the trend using the expansion of the histogram.
How to filter out false signals?
Divergence can be used to filter out false signals.
Divergence is when the MACD indicator shows a signal contrary to the main chart. There are two types;
• Bullish divergence
This is when the chart shows a decline in the value of an asset and the MACD shows an increase in the value of the asset. It has been illustrated below.

• Bearish divergence.
It is the opposite of bullish divergence. This is when the chart shows a rise in the price of the asset and the MACD indicator shows otherwise. An example can be seen below.

How can the MACD indicator be used to extract points or support and resistance levels on the chart? Use an example to explain the strategy.
Cryptocurrency support is the point where an asset stops falling in price and starts rising in price and the subsequent falls in price after the lowest point does not go down beyond the support price.
Resistance is the point where an asset loses price after an increase and the subsequent price increase do not go beyond the resistance point.
The crossing of the MACD line can be traced up to the chart to make support and resistance points on the chart.
It can be seen from the screenshot how the MACD crossing was traced to create support and resistance.


Review the chart of any pair and present the various signals from the MACD

I spotted a bullish reversal when the MACD line crossed above the signal line.
The bearish reversal was also spotted when the MACD crosses below the signal line. I was able to find a support zone when I traced the crosses to the chart.
Conclusion
The MACD indicator is a good trading tool. It is not 100% correct as it can give false signals. MACD can be a very powerful trading tool when coupled with other trading tools or indicators.
Thank you
Hi @gentles
Thanks for your participation in the Steemit Crypto Academy
Feedback
This is fairly done. Your article lacks an in-depth trading analysis. Kindly put more effort into your work.
Homework task
6