Steemit Crypto Academy | Season 4: Week 2 | Homework post of @kouba01 || Volume Indicator by @dabeerahmed
Yesterday, I learned all about volume indicator, trading with volume indicator, on balance on volume indicator, pros and cons of volume indicator and many other things from the post of our respected professor @kouba01 and here is my homework task in this regard. So let's get started without wasting much time.


Question no 1:
Explain the volume indicator in your own words.
THE VOLUME INDICATOR
Volume is one of the most important indicator which is used to analyze the market situation and liquidity. Price of the asset and the number of asset traded in a given period of time plays a significant role in analyzing the volume of the asset. It assesses the market trend and chart. Most of the indicators uses volume to make trading signals.
The best way to assess trend confirmation and price movement is to use the volume indicator. It is represented by the vertical columns below the chart. These vertical columns represents us the amount of buying, selling and trading occurs during the whole day. Increase in the size of the bar indicates higher volume i.e. higher trading activity, on the other hand decrease in the size of the bar indicates lower volume i.e. lower trading activity. These bars are also provided with two colors i.e. green and red in which the green color shows the current trading volume is greater then the previous one and the red color shows that the current trading volume is lesser then the previous one.

Screenshot taken from Binance Platform
The volume indicator is also a good way to see how market will react in the future. The volume in the market assists the trader in correlating price action and the formation of the volume informs us about the market trend. As a result, combining volume with various different technical indicators will make you significantly more powerful than one who does not use gives priority to the volume indicators.
Another main advantage of volume is that it provides early signals which help us to determine the direction of the trend earlier. It monitors the market trend a way earlier than many other indicators.
Question no 2:
Use a platform other than Tradingview to present the volume indicator on a chart and show how to configure its parameters by justifying your choices. (Screenshot required)
Presenting Volume indicator on a chart
To present a volume indicator on a chart I will be using Binance Exchange Platform.
Step 1: Go to official website of Binance Exchange Platform and then go through the process of login. After login to binance website hit the trade tab, a dropdown will appear on the screen, now click on the Advance option from the dropdown to go to the chart section.

Screenshot taken from Binance Platform
Step 2: Now click on the expansion button which is present on the top right of the chart. By clicking on it, you can now see the expanded version of the chart.

Screenshot taken from Binance Platform

Screenshot taken from Binance Platform
Step 3: In the expanded version of the chart, now hit the indicator button which is present at the top of the chart, a screen regarding indicators will appear as shown in the screenshot below;
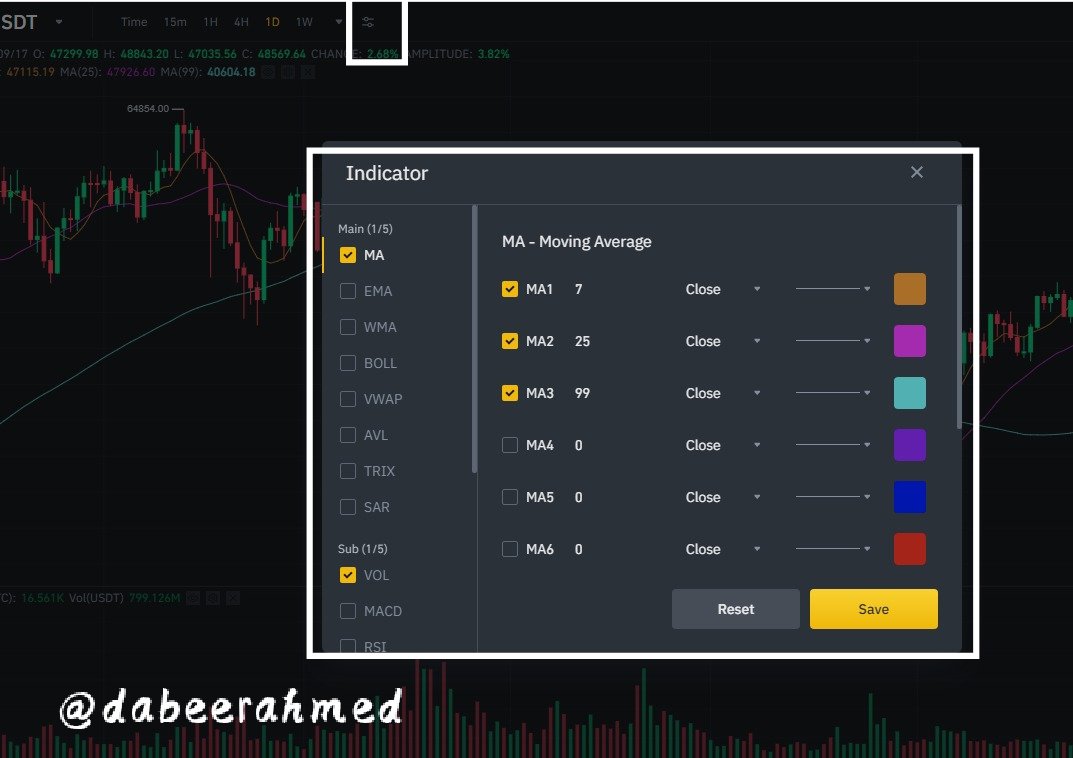
Screenshot taken from Binance Platform
Step 4: On the indicator screen, go to the sub section and select volume as shown in the image below. Now set the period and click on save button. I have set the period 3.

Screenshot taken from Binance Platform
After completing all the steps provided above the volume indicator with a 3-day SMA period will be added to the chart. The screenshot of the chart is given below;

Screenshot taken from Binance Platform
Question no 3:
What is the link between Volume and Trend and How to use volume to predict a trend reversal? (Screenshot required)
Link Between Volume and Trend
As I have mentioned above that volume indicator is very helpful to determine the direction of the market weather the market is in bullish mode or in bearish mode. Now lets take a deep analysis on the combination of volume and trend.
If the price of an asset increases but the volume of that asset is decreases, then it considered as down trend or bearish trend. Suppose a coin whose price continues to increase and the volume continues to decrease, so it is believed the uptrend of the price of that coin is about to turn in a downtrend soon and this is not the strong time buy.
If the price is moving down and the volume is also moving down then it is considered as the market is in the downtrend i.e. bearish trend which can be converted into uptrend any time, so this this not the strong time to sell any of your asset.
When the price is moving up and the volume is also moving up, this is sign of uptrend i.e. bullish market and the strong time for the trader to trade any of this asset.
One more highlight of the volume is that the increasing or decreasing of a single candle of volume doesn't make any difference in the trend of the market. Many traders do change their positions in the market after seeing the increasing and decreasing candle of volume in the market which results them in losses.
How Volume can be used to Predict Trend Reversal
As I have mentioned in the above paragraph that when the price and as well as the volume moves down whicch shows us the down trend but there is the huge possibility of this down trend to converted in the uptrend, hence we can see a trend reversal in the market using volume. But in this situation the trader needs to be more focused towards the market because here we to focus on the volume candle, if the volume candle is on the buy side then we can indicate that the next move of the market can show a uptrend i.e. bullishness can be seen in the market. Lets take a look at the chart which is shared below;

Screenshot taken from Binance Platform
In the above shared image you can clearly see in the one week chart of atom that the downtrend in the price and as well as the downtrend in the volume results in the uptrend in the price as well as volume which shows us the trend reversal.
Question no 4:
How to use the volume to have a signal confirmation? (Screenshot required)
How to use Volume for Signal Confirmation
The volume indicator can also be used to get trade signals and confirmation of a trade signal. We'll need to look at the nearby Support and Resistance Zones to get the perfect signals of Volume. If the volume is high and the price breakout to the strong resistance level, then this indicates that the bullish trend is around the corner and the uptrend can be seen anytime and you can take entry to the market when the next candle is formed above the breakout point. Same case is for the support that if the volume is high and the price breakout is on the support level, then this means that the bearish trend is around the corner and the downtrend can be seen anytime, and now you can exit from the market once when the next candle is formed below the breakout point.
Lets take a look at all these breakout levels by the help of chart.
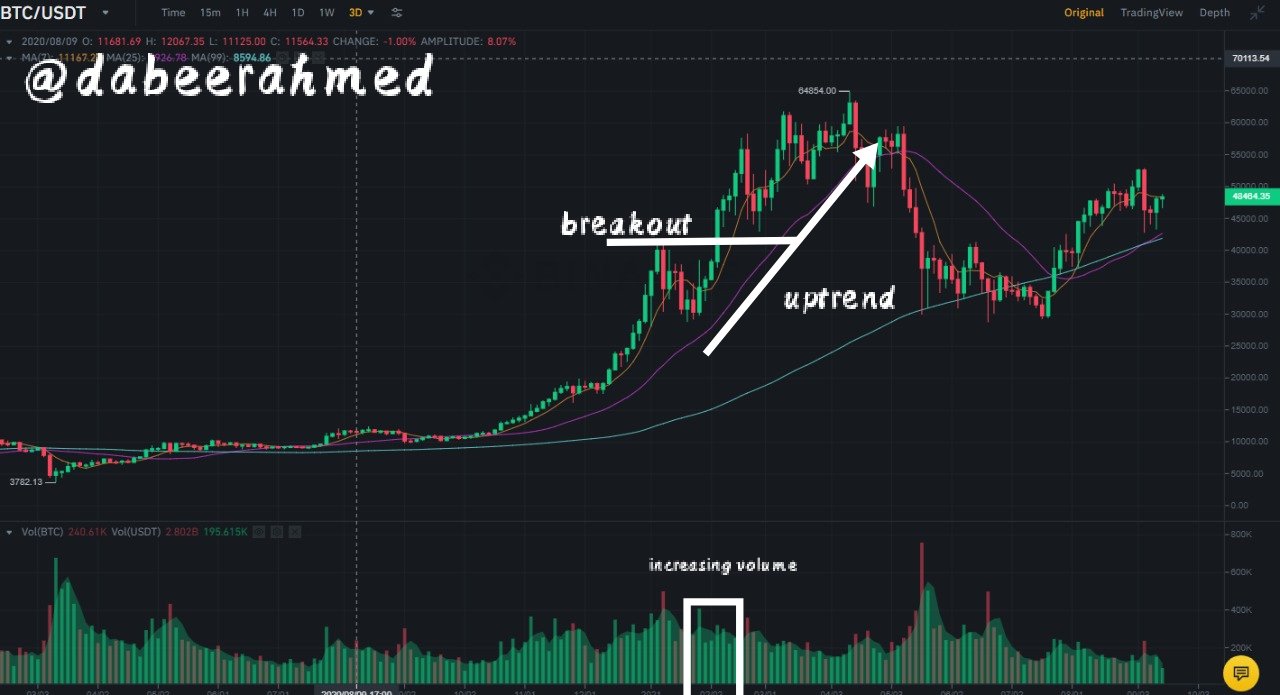
Screenshot taken from Binance Platform
In the above given picture you can clearly see the breakout on the resistance level as I have also drawn a line on the resistance zone for better understanding. Here we can also see the increase in the volume which led the market towards uptrend. So whenever you see an increase in a volume candle after the resistance price breakout, entry can be taken.

Screenshot taken from Binance Platform
In the above given image you can clearly see the breakout on the support level as I have also drawn a line on the support zone for better understanding. Here we can also see the decrease in the volume which led the market towards downtrend. So whenever you see a decrease in a volume candle after the support price breakout, take an exit from the market.
Question no 5:
How does the volume reflect the evolution of prices in the charts and why does the volume sometimes anticipate the price? (Screenshot required)
The volume incorporates price changes If the price of the product increases, we expect an expansion, which shows that the merchants are interested. Each time the market swings up or down, the volume also tracks bullish or bellying peaks. After such an increase, when traders lock in profits and the value for a product decreases, we see a volume decrease. The volume frequently forecasts the value of a market where the bigger volume in the volume diagram sometimes indicates, but the value often shows no such expansion because of the volume that is sometimes expected.
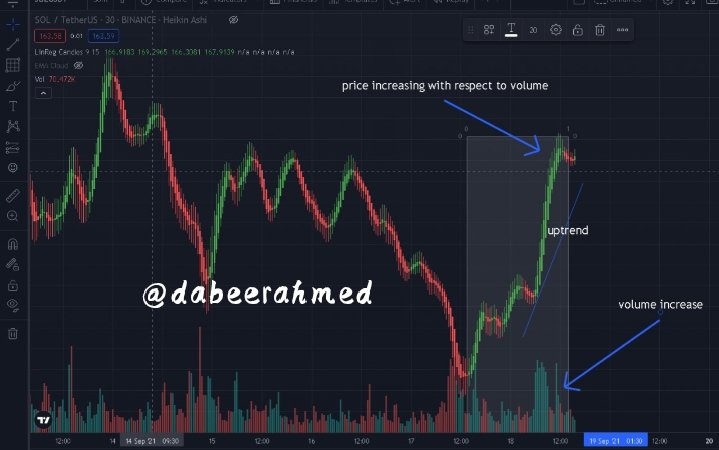
Screenshot taken from trading view Platform
The above given chart is of sol/usdt. As you can see the uptrend in the above chart, this is because the volume of the coin is increasing due to the increase in the buying of the coin. So when the volume goes p the demand of that coin increases and this results in the increase in the price of the coin i.e. uptrend.

Screenshot taken from Trading view Platform
Similarly here you can see the downtrend in the above given chart because the price of the coin is decreasing and due to the decrease in the price of the coin the volume is also decreasing. So when the price goes down the volume of coin also goes down due to the major selling in the coin which result in the downtrend of the coin.
Question no 6:
Is it better to use the volume indicator alone or use it in parallel with another indicator when trading? Justify your answer
How to use Volume Indicator
In my view I think it is better to use volume indicator with different technical indicators. Everyone should be aware not to use a single indicator for trading because nobody knows the next move of the market and using only a single indicator can lag in many areas because the signal provided by a single indicator can be resulted in a fake-out, we should consider atleast 2-3 indicators. So using volume indicator with different indicators will decrease your risk level by providing good support and resistance level, market trendline to avoid any type of fake-out.
Volume indicators are the finest indications of trend strength, and employing them in conjunction with moving averages provides the best trading setup. You can use moving averages to predict price movement and then enter trades by ensuring that the volume is providing a strong signal.
As I have mentioned above that volume indicator is used to understand the price movement of the market and it shows the volume of the asset. But we have to adhere that a single indicator can not give a 100% perfect signal. When we combine 2-3 indicators and if they are giving buying signals, then it means that this is the oppurtunity to buy, same case is with sell. But if we use don't use combined indicator then most of trader have went through the problem where one indicator is giving a buying signal and the other one is giving a selling signal which is so confusing. So the use of volume indicator with a parallel indicator is a better choice.
Question no 7:
The volume indicators are multiple, choose one of them to briefly explain its usefulness in crypto trading.
Volume RSI indicator
Rsi indicator is a most commonly used indicators by traders. The volume RSI indicator is a lot similar to the RSI indicator and the difference between these two is that the movement of price and volume calculates the upper as well as the lower bound of the indicator. The volume RSI indicator normally used to generate signal for short term investment. This indicator tracks an asset's buy/sell orders over the period of time. In this indicator 50% is the central level and anything above or below central level will generates the signal with correspondent.
Usage of Volume RSI indicator in trading
As I have mentioned above that 50% is the central of RSI indicator and if the movement seen from above 50% line to below 50% line, then we can determine it as a bearish signal which means that a lot selling of the asset is going on.
Similarly if the movement is seen from below 50% line to above 50% line, then we can determine it as a bullish signal which means that a lot of buying of the asset is going on.
let's understand it with the help of a chart which is shared below;

Screenshot taken from Trading view Platform
The above ADAUSDT chart shows the volume of buying and selling assets.
Question no 8:
Conclusion:
Conclusion
As we all know that a lot of different crypto currency coins are now launched in the crypto market and many of the coins are on its way to get launched in the recent time. So to analyze these crypto coins for buying and selling purpose many other different types of indicators are now used all over the world, the volume indicator is one of those indicator.
The volume indicator is really intriguing as it provides it user to analyze the upcoming situation of the market. It uses the movement of price as well as volume at a given period of time to generate signals. It helps all the traders to understand about the occurance of uptrend and downtrends. It also help us to analyze the time reversal, anticipation of price movements a bit earlier then other coins. However it should be used with other different indicators to get better results and to avoid fake-outs.
There are many different types of volume indicators which also help us to determine the market situation or to visualize future situation of the market.
Thats all fro my side. I hope you like it.
#kouba-s4week2 #cryptoacademy #steemit #steem #volume #steemexclusive
Hello @dabeerahmed,
Thank you for participating in the 2nd Week Crypto Course in its 4th season and for your efforts to complete the suggested tasks, you deserve a Total|5.5/10 rating, according to the following scale:
My review :
Work with medium content, where all the answers were varied in terms of analysis and examples adopted to explain the points raised for interpretation. Here are some notes:
This choice could have been justified.
There are many other signals that can be addressed and highlight the role of the indicator in confirming them.
The rest of the answers varied in the depth and efficacy of their analysis.
Thanks again for your effort, and we look forward to reading your next work.
Sincerely,@kouba01