Crypto Academy / S4W2 - Homework post by @armstrongdiho

INTRODUCTION
In affairs of cryptocurrency, it is very important to understand the present state of the market before trade commences since cryptocurrency has a volatile nature. And one of the possible means to understand the market state at a given timeframe is through volume indicator. With the volume indicator, you can understand and interpret between the buyer and the seller who is in control.
VOLUME INDICATOR
Volume indicator is one of the important technical Indicators which a trader can use in making a good trading decision. It indicates the quantity at which an asset has been traded as such can be used to reveal the interactions between the buyers and the sellers within a specific timeframe. However, It is usually displayed on a crypto chart as vertical bars and is usually found just beneath the candlestick charts.
The unique aspect of the volume indicator is that when there is high pressure on the market either from the sellers or buyers, instantly it there will be a long candle meaning when volume bar becomes bigger when there is high trading pressure on the market. Also, the same is applicable when there is low trading activity in the market but in this case, there is the formation of small/short candles, that's the volume bar become smaller/short when the activity of the market is low.
Generally, cryptocurrency has a volatile nature and this is caused as a result of the volume within the time frame. Hence, a savvy trader uses the volume indicators to understand and interpret the present state of the market, and can as well detect the present price movement.
One of my trading strategies is the volume indicators because they give signals regarding the interaction between the sellers and buyers. It is always important to know between the buyer and the seller who is in charge and one of the technical indicators that can do that is called the volume indicator.
Broadly speaking, the use of volume indicator when trading is very important and beneficial because it helps to highlights the level of liquidity. Most of the time, I normally use the volume to ascertain my entry and exit points. Moreover, note that the volumes vary from different cryptocurrency such as BTC, STEEM, TRX, ETH. So when a trader finds out the current market strength, then they will make a trade decision.
SETTING UP THE VOLUME INDICATOR ON BINANCE WEB
Although I'm familiar with the use of TradingView to make my analysis for the sake of this task I will be using another of my favourite known as Binance Web. Hence, I will show the settings using Binance Web.
Though the volume has been added to the chart by default which shows how the importance of the volume indicator. Below are the steps.
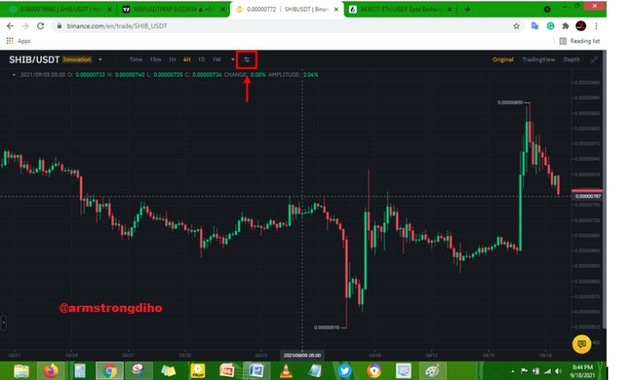
Open any crypto chart of your choice on the Binance web

The image above shows how to set your chart on full screen.
- click on the technical indicator button. The below image will clarify us better.

On the landing page, you will see a dialogue box, on your left-hand side, click on 'Vol' to set the volume indicator. On the next image, the volume indicator will popup.

Now, the volume indicator is set but you can set/adjust the period depending on your choice. So here are the step to set your volume period for the moving average.

- click on save.
Here, the volume has been added and has the same colour as the candle on the crypto chart. So, beneath the chart is the volume bar and the place marked is the volume indicator and the low green area shows the Moving Average.

The link between Volume and Trend and How to Use volume to predict a trend reversal
There is this connection between volume and trend which a trader is worth focusing on. Volume is a vital factor that can ascertain trends. That's when there is high volume on the market be it from the buyers or sellers, shows a strong trend(bullish or bearish). And the strong trend shows high buying or selling pressure on the price of the asset from the buyer and seller respectively. Let's check out the relationship between the volume and price uptrend, and downtrend.
VOLUME AND UPTREND
Uptrend is formed when the sellers are the ones dominating or influencing more on the market and the buyers is under pressure to buy at that moment causing large volume within the timeframe which makes the price tally. That's high momentum of buying interest tends to rally the market.
*IMAGE SHOWING CONNECTION BETWEEN VOLUME AND UPTREND

On the crypto chart, we can see the relationship between volume and price trends. High pressure from the buyers lead to an uptrend and it can be confirmed at the volume bars. Also, looking at the chart, I observed that when the volume starts getting weaker, the trend instantly starts decreasing showing the buying pressure from the buyer has reduced.
Therefore, it shows that we can use the volume indicator as a means of confirming price trends just as seen on the chart. Also, a savvy trader who has identified the decrease in the volume will know that the trend will weaken as well.
VOLUME AND DOWNTREND
The downtrend is formed when the buyers are the ones dominating or influencing more on the market and the sellers is under pressure to sell at that moment causing large volume on the price of the asset within a timeframe. That's high momentum of selling interest tends to fall the price of the asset causing the market to observe a downtrend.
IMAGE SHOWING CONNECTION BETWEEN VOLUME AND DOWNTREND

On the crypto chart, we can see the relationship between volume and downtrend. High pressure from the seller lead to a downtrend and it can be confirmed at the volume bars. Also, looking at the chart, shows that when the volume starts getting weaker, the trend instantly starts decreasing showing the selling pressure from the buyer has reduced.
Then, it shows that we can use the volume indicator as a means of confirming the downtrend just as seen on the chart. Also, a savvy trader who has identified the decrease in the volume will know that the downtrend is weak and there might be a possible reversal.
VOLUME AND TREND REVERSAL
The volume indicator is not only limited to detect trends, it can also be used to predict a trend reversal. When a market is in a trend, whenever the volume gets exhausted regardless of the price moving in the direction of the trend it shows a trend reversal.
However, an uptrend transition occurs when the downtrend volume starts getting weaken as the price falls. That's Decreasing volume and price movement serves as an indication of possible uptrend reversal.
IMAGE SHOWING TREND REVERSAL

Then, in the case of uptrend reversal to downtrend, when the volume starts getting weaken as the price movement rise, that's a decline in the volume in an uptrend shows an uptrend reversal to downtrend
USING VOLUME FOR CONFIRMATION OF SIGNAL
Volume indicator can be used as a means of confirmation of signals. Let's check out.
SPOT BREAKOUT
With the help of the volume indicator, we can spot breakout for both support and resistance. For the case of resistance breakout, the trader has to note the volume when the price test the resistance level. Hence, when a price of asset rallies, low volume at that moment will make the price fall, perhaps, high volume tends to make the price movement continue in its upward movement.
However, a savvy trader who pictured out the high volume as the price rally to the resistance point serves as a confirmation of resistance breakout. The image below shows resistance breakout. Looking at it, there was a high volume which makes the price to test the resistance level as such serve as confirmation of the breakout signal.
IMAGE SHOWING RESISTANCE BREAKOUT

For the case of confirming support breakout, it requires the trader to be observant, to notice volume indicators when the price test the support points. Price movement falls as a result of low volume at that period which makes the price create a support zone. Also, when there is high volume at that period, the price movement rally back to its upward move.
Hence, when a savvy trader notices the movement of price approach towards the support zone as a result of high volume at that moment it is a confirmation of support breakout. The image below shows the Support breakout and looking at it, there was a high volume which makes the price movement test the support zone as such confirmed the support breakout signal.
IMAGE SHOWING A SUPPORT BREAKOUT

How does the volume reflect the evolution of prices in the chart and why does the volume sometimes anticipate the price
Just as volume has a connection with trends so as it has with the price. Hence, it is very important to understand that the volume within a timeframe can reflect the evolution of price. An increase in the volume within a successive timeframe entails that the price of an asset is increasing which signify the high interest of buyers in the asset.
Although we can say volume reflects the evolution of price when we observed that the price has increase and it is instantly followed by an increase in volume. From the image below, the price appreciated and the volume shows an increase at the same period.

PRICE ANTICIPATION
In most cases, the price of the asset will not rise but see the volume rise. Just for some time the price will rise as such correspond with the rise of the volume. Lets check out the image for better clarification.
IMAGING SHOWING PRICE ANTICIPATION USING VOLUME

Is it better to use the volume indicator alone or use it in parallel with another indicator when trading
Indicators are important but I don't think they should be standalone to make trade decisions. Although they play role in the trading by providing signals and serve as means of confirmation but should be in conjunction with other technical analysis tools.
The volume indicator is very important but has some limitations since it only renders information about the quantity of the traded asset over some time. Hence, it is not ideal to use it as a standalone indicator. Using only volume indicators alone can not detect market noise.
More application of indicators or technical tools, the more trading possibilities to give accurate trading signals and to eliminate market noise.
Therefore, I strongly recommend the use of volume indicators in conjunction with other relevant technical analysis tools like MACD, RSI, price action, price action as well as support and resistance, to minimise market noise, filter false signals and fakeouts in the market.
The volume indicators are multiple, choose one of them to briefly explain its usefulness in crypto trading.
There is numerous type of volume indicators can be seen different trading platforms and their data vary.
On-Balance-Volume (OBV) INDICATOR
The on-balance volume indicator is among the top volume-based indicator which traders use for technical analysis. However, this indicator measures the buying and selling pressure respectively through the use of the trade volume changes to forecast the current price movements. OBV metric was created first by Joseph Granville.
OBV is called a cumulative indicator because it derives its value by adding up the current volume and minus the volume by the previous period. Hence, the present value of the OBV is obtained from the previous period. OBV takes its data based on the value. So If the price rise, the volume is added instantly on the last periods, while if the price falls, the volume will then be minus from the past period of the OBV.
Usefulness of the On-Balance-Volume (OBV) indicator
UPTREND;

Uptrend is detected when there is an increase in the OBV regardless of the state of the price, that's the increase in OBV plus or minus of the price is equal to confirmation of possible uptrend by the OBV.
DOWNTREND;

However, if the price increase, but there is a decline in the OBV, it signifies a divergence and sends a message to the trader that there is a weak price movement. Also, the decline in both OBV and price represent the bearish trend.
CONCLUSION
Volume indicator is an important technical indicator that is worth focusing on when trading. Most traders overlook volume indicators because they never understand it's usefulness. However, the volume has a distinct relationship with the price as well as the trend. With a volume indicator, a trader will identify the state of the market and the present influence of the buyer or seller.
Also, it can be used by a trader to confirm price movement which can be either uptrend or downtrend. The volume indicator is set as default on cryptocurrency. This volume indicator is beneath the crypto chart and is characterised by the similar colour of the candlestick. Though there are some we needed to add as well as to configure them.
Furthermore, it is not ideal to use a single indicator to make trade decisions include the volume indicator because it can filter false signals, market noise and fake out instead using should be used with other relevant technical analysis tools or another indicator like the MACD, RSI, etc.
THANKS FOR READING THROUGH
Cc:
@kouba01
@armstrongdiho, Please do not post with "error/uncomplete" content to book a post before the participation deadline expires. Our community punishes this practice because it violates the laws of fair competition.
Cc- @sapwood @steemcurator01
I appreciate your comment and I'm sorry about that Prof. @kouba01 I promise never to do that again. I have learnt my lesson.