[Crypto Trading Using Zig Zag Indicator]- Crypto Academy /S6W1-Homework Post for kouba01 by @abdu.navi03
Hello everyone. How are you all? I hope fine. I warmly welcome you all to season 6 of the crypto academy. This is my second dynamic course of this season.
In this lecture by Professor @kouba01 , we learned the basics of Trends and indicators that identify it


Crypto technology brought revolution and with that revolution, he made a very volatile market in which traders can trade, its volatility is what makes people fascinated about it. And because of it more and more people are joining it. Those are the people who didn’t do stock trading or forex trading want to join this business without having any experience or knowledge. Because of its fantastic profits stories. But in any business when there are profits, there are losses also. And according to many world-renown traders, in any trading market, whether crypto, forex, or stocks, a trader, whether a naive one or an experienced one, can make a lot of profit just by following the trend. Just like in this recent bearish trend a guy I know recovered his loss and turned into profit by shorting BTC from 69k to 39k with 80x leverage. So just like that anyone who follows trends can be in great profit.
But for this, the most important thing is to know when will be the trend start and when will it be ended. Trend identification is the most important thing in any trading market. These trading markets are run according to people’s sentiments. Anyone who can read the sentiments can earn from it. Especially crypto, many of you must know how trending coins hit the moon without having any proper fundamentals or technicals, yes I’m talking about dodge coin.
Traders use any kinds of tools, strategies, and indicators to learn the current trend, to learn the previous trend, and to predict the future trend. This is as important, as understanding any other technicality. Knowledge about trends can keep you in profits in long-term and mid-term trades. But it is not important for short-term or futures trading. However, for trend identification, ZigZag patterns are the best. They are designed only to catch trends, whether they are current or previous. Based on these two data one can predict the future trend
To understand this indicator we must first understand what’s the zigzag pattern is and how it behaves that it gets able to tell us the current trend.
First of all, as the name stands zigzag, it indicates an oscillation movement at first. But the zig-zag pattern is a bit different type of oscillation. It is a line formed between the highs and lows of the price movement. As the market oscillates, the zigzag indicator is famous to know the sentiments of the people present in the market. This indicator or pattern doesn’t give future signals or predictions nor it can tell you the volatility, strength of users or sellers, etc. But it can tell you the current state of the market. Through it, you can make decisions for long term investments
As the zigzag indicator is responsible for determining the trends of the market by previous historical data, its calculation can be explained in words easier than in the numerical systems.
So when you apply the zigzag indicator in tradingview.com you’d only to the settings, you will see that there are two options, deviation, and depth. These two parameters are so important to understand the usage of the zigzag indicators.
DEPTH
It Is the minimum number of candle bars until which a new trend line either showing a high or a low can not be formed. In easy words suppose the depth is 5. And currently, the price has moved from $100 to $50 of an asset in the period of 10 candles. Then in the next 4 candles, the price went up to $120, but the zigzag line can not be formed. Why is that because depth isn’t allowing it? As soon as the 5th candle forms and the price will be above $50, the line may form.
USAGE OF DEPTH
As I stated repeatedly, this indicator is a trend-catching indicator. Therefore noises, or short trend candles, which are volatile and can not be trusted for any kind of TA (technical analysis) filter out. In standard settings on tradingview platform, the depth is 10 by default.
DEVIATION
It is the minimum percentage before the reversal. Let’s understand it with a simple example. Suppose there’s an asset of price $100 and it retraces to $50, that means it retraces to 50%. And a downward zigzag line is formed. Now if you set the deviation to 10% then the new zigzag line towards upward will only form when the price takes correction and moves upward at least 10 percent.
In this way, not only highs and lows are determined but determined accurately and several support and resistance drawings can also be formed by it.
Through any chart screening platform of any asset, whether it id crypto,forex or stocks where zigzag indicator is available, you can use it and change its setting

By clicking the setting's icon you can go and change the settings

As you can see in this screenshot there are two options of deviation and depth to change in settings
As I already explained what deviation and depth is
Allow me to show you pictorially the difference on the price chart by changing the parameters
1-DEVIATION

In this above screenshot of BTC/USDT, having timeframe of 4H, from binance on tradingview application. We can clearly see the difference in both zigzag indicators with different deviation settings. It is clear how changing deviation changes the zigzag line and by the increase of just 10 percent of deviation the line of zigzag also increases. The major change is;
FILTERATION OF NOISES
For long-term traders, who want to trade for a long period of time, a higher deviation percentage is recommended. It helps a trader to predict the big dumps and big pumps.
But for midterm traders, it is not recommended at it won't contain enough knowledge
2-DEPTH

In the above screenshot of BTC/USDT, having timeframe of 4H, from Binance on tradingview application. We can clearly see the difference in both zigzag indicators with different depth settings, it is clear how changing depth change the zigzag line by the increase of 40 Depth. The major change is;
FILTRATION OF FALSE TRENDS
It is clear by increasing depth, the indicator is more prawn to check the entry of more buyers and sellers, the more the value of depth, the more the indicator waits for the volume to increase either by bull pressure or bear pressure.
CHANGING OF SETTINGS
Does a trader need to change the settings for better trade? Well, mostly it depends on the trader and the trader’s respective trading strategy. But in general, and in my opinion, traders should not change the setting, because, the first reason is it doesn’t depend on the time frame, so if you are looking for midterm trading upcoming trends, you can just shift to the low term timeframe such as 30m or 1H. And if you’re looking for a strong trend over a long-term period of time you can use a 4H chart or 1D chart is more advised. The second reason is in the crypto market, there’s much volatility, so catching such a long trend that would keep you a year is can not be done by technical analysis but can be done by fundamental analysis.
FIND THE TREND
To find the trend, or predict the next trend with this indicator there are some steps since the indicator itself isn’t designed to give signals about future trends.
To predict the future, we must know the present. Therefore the following steps are according to it;
1-CHECK HIGHS
The first step is to check the highs in the history of price, if they are harmonic, it means they are in a strong trend. The more they are harmonic the more the trend is strong.

In the above screenshot BTC/USDT off Binance exchange from tradingview application, having timeframe of 4H, we can see that the trend line has been drawn on descending highs, so for the intraday trader, it is enough just to short the asset when it hits the line, that time.
2-CHECK LOWS
The second step is to check the lows in the history of price, if they are harmonic, it means they are in a strong trend. The more they are harmonic, the more the trend is strong.

In this above screenshot of BTC/USDT, of Binance exchange from tradingview application, having timeframe of 4H, we can see that the trend line has been drawn on descending lows, so for the intraday traders, it is enough just to buy the asset when the price hits the line and sell it at above line, that time.
3-IDENTIFYING PATTERN
The third step is to identify what pattern does this trend lines of highs and lows. In this case, it is clear that the pattern is falling wedge pattern
4-PREDICTION OF FUTURE
Now from the trend line, support and resistance have been formed now, whenever the price break the resistance then the uptrend will go up and whenever the support breaks by the price, the trend will go downward.

As in this screenshot you can see when the wedge pattern’s resistance gets broken by the price, the prices races up to the top and gained around $4000 dollar in price, which made up around an 8% increase from the breaking point of resistance to the ending of trend.
SUPPORT AND RESISTANCE BY ZIGZAG
I think to catch the support and resistance is the easiest use of zigzag indicator, as the support and resistance prices are pretty much very dear to every trader, especially for scalpers, as they buy the asset at support and sell it at resistance.
To draw support we must focus on the price chart and find the price range from where the price goes upward again. Please let me elaborate on it pictorially for better understanding.

In this screenshot, you can see how the support is underlined by the zigzag indicator, as prices already pumped up a couple of times from that price.
To draw resistance we must focus on the price chart and find the price range from where the price goes down again. Please let me elaborate on it pictorially for better understanding.

In this screenshot, you can see how the resistance is underlined by the zigzag indicator as prices already pumped down a couple of times from that price place, and it is also can be seen that when the resistance breaks by the price, the asset price pumped up more and more.
So here you can see how the zigzag indicator can help traders to draw the most important area of the price chart for the traders.
Using more than one indicator is always advisable whether you are an intraday trader or long-term trader. But as the professor asked, I will explain the CCI and ZigZag indicator combination, and the predictions that can be obtained from it.
But first, we must learn both the indicators respectively, their benefits and their disadvantages.
1-CCI
CCI or Commodity Channel Index, as its name, explains works upon the commodity. In easy words, it measures the difference between the current price and the historical average price and oscillates between 100 and -100 while 0 stays in the middle. With a median line is above zero, it means the price is above the historical average and is moving towards the upward trend, meanwhile when it is below zero, it means the price is less than the historical average. When the line is at 100, it does mean a strong trend going on but it also means, that many traders are in profit and the market could take correction when they book profit. And when it is at -100 it means that many traders have been closed their position and a downtrend is going on. But it also means that it can be the perfect spot for buyers to come into the market and push the price up to change the trend.
It can tell you an upcoming trend but it can not tell you the accommodation of people with their positions in the market. Therefore this indicator is good for long-term trades but not very good for futures with low liquidation.
2-ZIGZAG INDICATOR
As I already briefly explained the zigzag indicator I will just sum up all the points regarding the zigzag indicator. It is a very good indicator for predicting future trends and knowing current trends. But it can not generate signals for the trade.
Though these two indicators lack some things, when they use together they form an absolutely amazing combination. As the CCI gives a signal with the interpretation of the market while the ZigZag indicator literally works on it. So in simple words, the trend prediction that can be generated by the ZigZag trend can be checked with respect to the market through CCI and help traders to open a buy or sell position regarding it.
TRADING STRATEGY
A trading strategy is simple. Whenever the ZigZag forms the support or resistance, or gives the prediction of an upcoming bull or bear trend, the trader only has to note the CCI value before going into the trade.
FOR BUY SIGNAL
For buy signal upon breaking of resistance, if the value of CCI is above zero, then it’s a buy signal as the trend is gonna get stronger by the market’s people. Let me elaborate it pictorially

In this screenshot of BTC/USDT, having 30m of time frame, we can see that when the trend line that formed resistance get breaks the prices move upward and chart turn to bullish, a trader that is using CCI as the second indicator can confirm this signal to dodge from false signals by checking the value, as it is highlighted, the value is above zero in CCI.
FOR SELL SIGNAL
For sell signal upon breaking of support, if the value of CCI, is less than zero, then it's a sell signal as the trend is gonna get stronger by the market’s people. Let me elaborate on it pictorially.
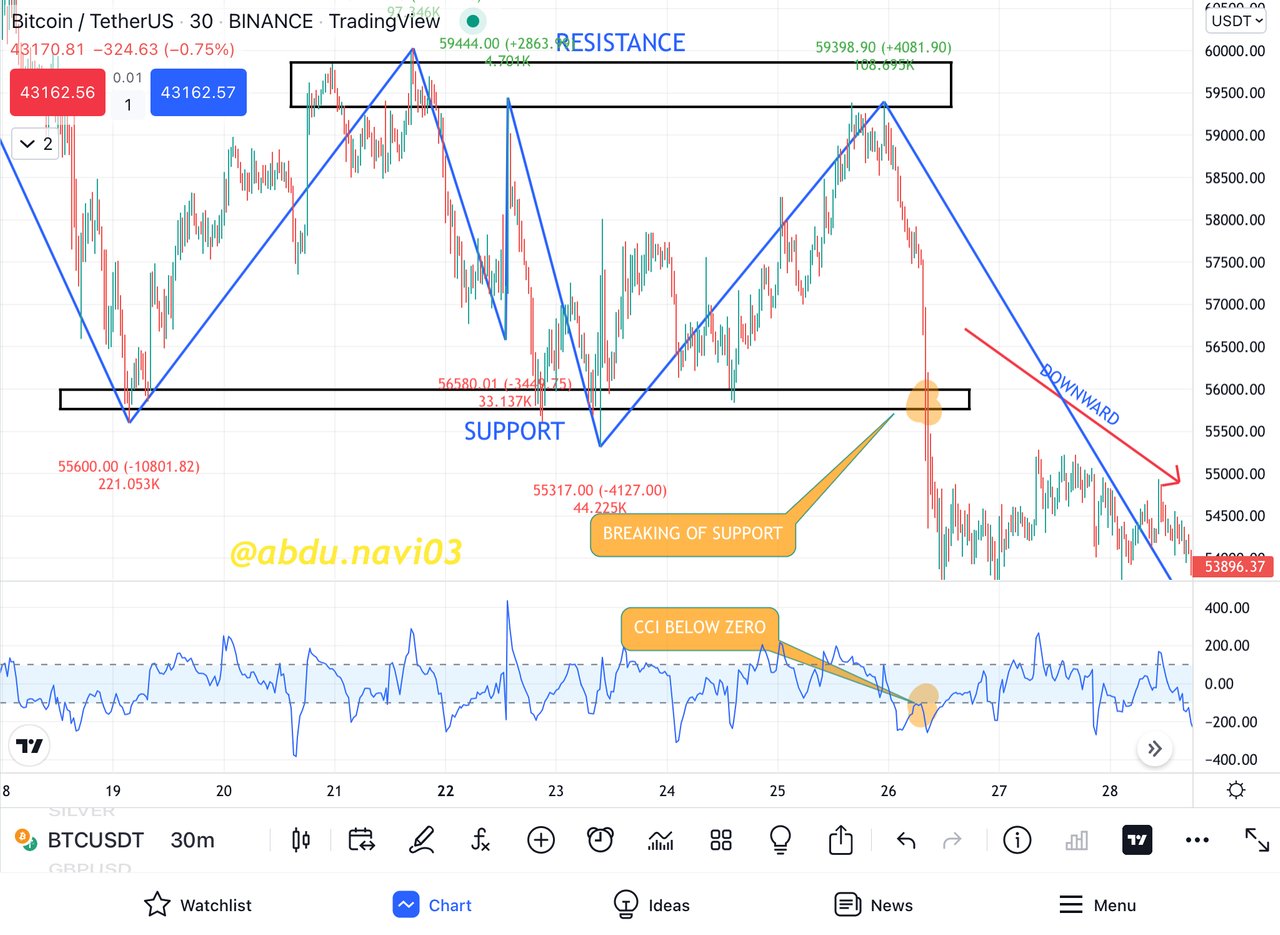
In this screenshot of BTC/USDT, having a time frame of 30m, we can see that when the trend line that formed support, get breaks, the prices move downward, and the chart turns to bearish, a trader that is using CCI as the second indicator and confirmed of the trend, can confirm this bear signal to dodge from a false prediction by checking the numerical value of CCI, as it is highlighted, the value of CCI is below zero.
Another aspect is that, as I stated, these two indicators respectively, and individually are only good for long-term trading, but when we combine them, we can use them for shorter time frames such as in this example, 30m chart.
The Crypto trading market is a very volatile market, and therefore a trader must be assured of what he is doing and on what he’s putting his hard-earned money. Therefore with any indicator let alone zigzag, with any other indicator, it is not only advisable but necessary to use any other indicator, pattern, or strategy to increase the percentage of surety. Therefore the answer to the respected professor’s question is YES. It is necessary to add indicators with zigzag indicators. But one can not add just any other indicator.
As the ZigZag indicator is a very good trend-catching indicator, traders are advised to use those indicators that are good with catching strong trends and market movements, to get the accuracy in results. A couple of indicators are mentioned below.
1-MACD
MACD or Moving Average Convergence Divergence indicator, as its name states, is the indicator based upon market convergence and divergence, which means it notes the entries and exits of the market by the trader, to generate the signal, with the moving average. Moreover, as it works on exits and entries, it is obvious that it has a keen eye on Volume also, therefore it contains volume too. With a moving average of the desired length.
BUY STRATEGY
Its buying signal strategy is pretty simple, whenever the moving average, crosses the middle line and comes from the lower area, there’s a buy signal, with the condition of having enough volume in the market, or enough traders in the market, to give surety to the signal, otherwise the indicator false rapidly.
SELL SIGNAL
Its selling signal strategy is pretty simple, whenever the moving average crosses the middle line and comes from the upper area, there’s a sell signal, with the condition of having enough volume in the market, or enough traders in the market, to give surety to the signal, otherwise, the indicator will rise rapidly again.
Let’s see the combination effect of zigzag and MACD

In this screenshot of BTC/USDT of Binance exchange from tradingview application, having a time frame of 30m, we can see that though MACD gave signal before the breaking of the trend but using to indicators means, waiting for both signals to dodge false signals, therefore, it can be seen on the breaking of resistance, price moves upward drastically that also gave the volume in MACD means, it will be an uptrend from now on.
2-RSI
RSI or relative strength index’s prime feature is to tell the strength of the bulls and bears in the market, in simple words, the strength of buyers and sellers. But people have many problems with MACD as they can not understand it very well. So RSI is an oscillating indicator, which oscillates between 100 and 0. These values tell the strength. If the value is between 70-100 it means bulls, or buyers are in control and if the value is between 30-0, it means sellers or bears are in control of the market. This indicator though directly doesn’t tell the trend. But the double top on RSI and double low on RSI are bullish trends and bearish trends respectively. That happens because the buyers that enter the market at the time of the start of the trend, didn’t leave the market meanwhile others also come in in bullish trends and vice versa in a bearish trend.
BUY STRATEGY
In catching trend, buying signal is when the market has lots of green volumes and RSI already hit above 70.
SELL SIGNAL
In catching trend, sell signal is when the market has lots of red volumes and RSI already hit below 30
Lets se the combination of ZigZag and RSI

In the above screenshot of BTC/USDT we can see that when the resistance of the trend gets broken the RSI also formed a double top, indicating a strong bullish trend.
That is how a non-trend indicating indicator can also be used by zigzag for correct signals.
Every indicator or strategy or even candlestick formation or price chart has its advantages and disadvantages as it enhances one thing at the expense of another. Below, here is the list of advantages and disadvantages of the zigzag indicator.
1-TREND CATCHING
According to many experienced traders, and many studies, traders make the most profit in trend, which means either in a bull market or bear market. Therefore for those traders, indicators like the zigzag indicator are very useful as they can catch the current trend and help you to identify the next one.
2-EASY TO READ
This indicator makes the market very easy to read and very easy to see the trend, it is sharper than the line chart, which provides the perfect points to learn the trend.
3-SUPPORT AND RESISTANCE
As I said in my assignment, the price levels of support and resistance are the most important for any individual or group of traders. Meanwhile, this indicator helps traders to identify these points very easily.
1-SIGNALS
It does not provide signals, it just tells the previous data of the market, even the most current trend line is a fluctuating trend line.
2-TIMEFRAME
This indicator, if used alone, and not with any other indicator, isn’t very useful for short spam of times. Results in the loss for scalpers.
3-COMBINATIONS
This indicator can not work always great with any other indicator, to use this indicator we must first learn the indicators that suit it and learn them, only then we can get the best out of it.
CONCLUSION
The cryptocurrency trading market is a very volatile market and can go up and down in just one news. Therefore in this kind of market, traders want to know the current trend as soon as possible. Because in this kind of market, traders can earn fortunes in trends. Such as the BNB was $5 around 14 months back and now its value is above $500. If a trader caught this trend on time, then, he may not be able to get a profit of 100x but surely at least he made 2x of profit. This much volatility however sounds fascinating but very dangerous too, as how fast the prices can pile up, they can get destroyed very fast too. In this situation, indicators like the zigzag indicator are a Santa clause for a 5-year-old kid. Full of presents. Especially the important one of learning the trend.
THANK YOU.
ps: All the pictures have been sourced accordingly. The grammar was checked from grammarly.com while the markdowns have been done according to the Markdown Styling Guide.
Cc;
professor @kouba01
regards,
@abdu.navi03

Congratulations @abdu.navi03
This is the most positive post amongst

top 100hot posts on steemit at this moment.