steemhub.tech Weekly Traffic Analysis - August 16-22, 2025
SteemHub Analytics Report - Weekly Performance Overview

SteemHub.tech continues to serve as the main domain for all sites related to the Steem blockchain. Currently, there are 4 active sites:
- memory-game.steemhub.tech - Interactive game for Steem community
- stats.steemhub.tech - Analytics dashboard for tracking performance
- pixelcraft.steemhub.tech - Pixel art game for the community
- steemhub.tech - Main hub connecting all Steem-related projects
SteemHub provides essential tools and entertainment for the growing Steem community.
Reporting Period: August 16, 2025 to August 22, 2025
User Engagement Overview
Audience Analytics

| Metric | Value | Growth Trend |
|---|---|---|
| Total Users | 93 | Steady growth (+1 vs July) |
| New Users | 32 | 34.41% of total users |
| Total Sessions | 271 | Strong engagement (+50 vs July) |
| Sessions per User | 2.9 | Improved retention rate |
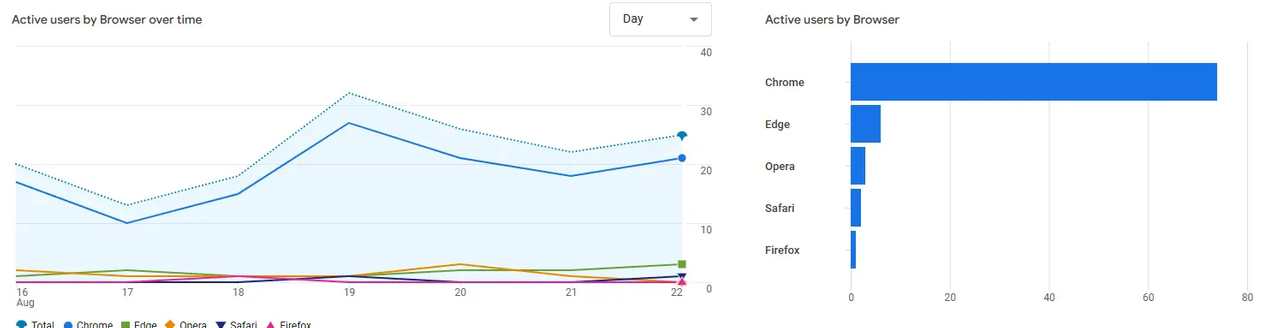
The user acquisition chart shows consistent performance with peak engagement on August 19th reaching nearly 40 daily users, demonstrating strong mid-week activity patterns.
Geographic Distribution
Active Users by Country
Our global reach continues to expand across multiple continents, with strengthened presence in key emerging markets:

| Country | Total Users | Percentage | Sessions | Session Share |
|---|---|---|---|---|
| Nigeria | 24 | 25.81% | 54 | 19.93% |
| Venezuela | 19 | 20.43% | 72 | 26.57% |
| Bangladesh | 13 | 13.98% | 40 | 14.76% |
| Pakistan | 10 | 10.75% | 32 | 11.81% |
| United States | 6 | 6.45% | 8 | 2.95% |
| Brazil | 4 | 4.30% | 19 | 7.01% |
| Colombia | 4 | 4.30% | 10 | 3.69% |
| Malaysia | 3 | 3.23% | 11 | 4.06% |
| Tunisia | 3 | 3.23% | 18 | 6.64% |
| Italy | 2 | 2.15% | 2 | 0.74% |
| Algeria | 1 | 1.08% | 1 | 0.37% |
| Chile | 1 | 1.08% | 1 | 0.37% |
| China | 1 | 1.08% | 1 | 0.37% |
| Czechia | 1 | 1.08% | 1 | 0.37% |
| Indonesia | 1 | 1.08% | 1 | 0.37% |
| Netherlands | 1 | 1.08% | 1 | 0.37% |
Geographic Insights:
- More balanced user distribution with Nigeria's dominance reduced to 25.81% (down from 40.22%)
- Venezuela shows exceptional engagement efficiency with 20.43% users generating 26.57% of sessions
- Strong growth in South Asian markets with Bangladesh (13.98%) and Pakistan (10.75%)
- Improved presence in developed markets including United States (6.45%)
- Enhanced engagement in Tunisia with high session-to-user ratio
- Total reach spans 16 countries, showing consistent global appeal
Technology Analytics
Browser Distribution
Chrome maintains its dominant position with improved user engagement patterns:
| Browser | Total Users | Percentage | Sessions | Session Efficiency |
|---|---|---|---|---|
| Chrome | 74 | 83.15% | 103 | 78.63% |
| Edge | 6 | 6.74% | 14 | 10.69% |
| Opera | 3 | 3.37% | 11 | 8.40% |
| Safari | 2 | 2.25% | 0 | 0% |
| Firefox | 1 | 1.12% | 1 | 0.76% |
| Phoenix Browser | 1 | 1.12% | 0 | 0% |
| Samsung Internet | 1 | 1.12% | 1 | 0.76% |
| YaBrowser | 1 | 1.12% | 1 | 0.76% |
Browser Performance Analysis:
- Chrome users show consistent engagement with 1.39 sessions per user
- Edge demonstrates strong engagement with 2.33 sessions per user
- Opera shows exceptional engagement efficiency (3.67 sessions per user)
- Growing browser diversity indicates expanding user base
Device Category Performance
Mobile-first strategy continues to show strong results:

| Device Type | Total Users | Percentage | Sessions | Mobile Advantage |
|---|---|---|---|---|
| Mobile | 67 | 72.04% | 185 | 68.27% |
| Desktop | 28 | 30.11% | 87 | 32.10% |
Device Usage Insights:
- Mobile dominance increased to 72.04% of users
- Mobile users average 2.76 sessions each vs 3.11 for desktop users
- Desktop users show higher per-user engagement despite smaller base
- Strong mobile optimization continues to drive platform adoption
Week-over-Week Performance Analysis
Key Improvements:
- Total Sessions: +22.6% increase (271 vs 221 sessions)
- User Engagement: Sessions per user improved from 2.4 to 2.9
- Geographic Balance: More distributed user base across regions
- Technology Diversity: Expanded browser usage patterns
Notable Trends:
- Peak activity shifted to mid-week (August 19th)
- Venezuelan users show highest engagement efficiency
- Desktop users demonstrate higher session intensity
- Consistent growth in established markets
This week's analytics demonstrate SteemHub's continued evolution in the Steem ecosystem with enhanced user engagement, improved geographic distribution, and strong technology adoption patterns. The mobile-first user base (72.04%) combined with increased session activity indicates successful platform optimization strategies.
Our more balanced geographic distribution reduces over-reliance on single markets while maintaining strong engagement metrics. The technology usage patterns show healthy diversification, while the significant session increase (+22.6%) demonstrates growing platform value for users.
Moving forward, capitalizing on the improved engagement rates and expanding the strong performance in key markets like Venezuela and Bangladesh will be crucial for sustainable growth. The consistent mobile optimization and cross-browser compatibility provide a solid foundation for continued platform expansion.
This report was generated using Google Analytics 4 data from August 16-22, 2025, focusing on user engagement, geographic distribution, and technology adoption patterns across the SteemHub ecosystem.
Vote for Me as a Witness
Support our continued development and analytics reporting:
- Visit Steemit Witness Voting
- Scroll down and type kafio.wit
- Click Vote
