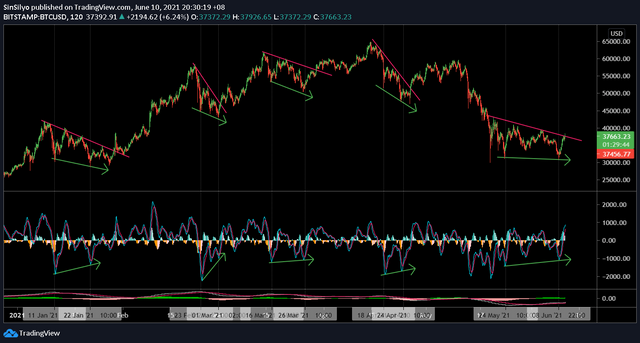
• Sign in
  • Sign up 
  • Welcome
  • FAQ
  • Switch to Night Mode
  • Stolen Accounts Recovery 
  • Change Account Password 
  • Vote for Witnesses 
  • Steem Proposals 
  • Developer Portal 
  • Steem Bluepaper 
  • SMT Whitepaper 
  • Steem Whitepaper 
  • Privacy Policy
  • Terms of Service
Homeby Witness Moecki
LoginSign up

Bitcoin chart

xfaqs01 (25)in DTube • 4 years ago

bitcoin chart at 2hour timeframe on MACD divergences and a breakouts from red line resistance, will previous price action repeat? chart!

image.png

#bitcoin #trading #chart #btc #indonesia #kr
4 years ago in DTube by xfaqs01 (25)
$0.00
    2 votes
    • + xfaqs01
    • + horacio89
    Reply 0