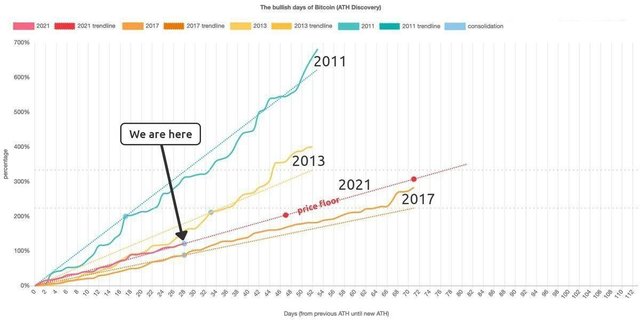
This graph represents all the Bullrun in #Bitcoin!
This graph represents all the #Bullrun in #Bitcoin, where straight is the trend to be followed and that #zigzag line is the movement following the trend (or we can say expected gains/ potential gains). Well, we can clearly see that we are in middle of the trend or even a bit below. Adding confluence to this we always see such type of heavy dumps and consolidation in between the rally. There's no such thing as new going on the market. but yeah, we might get shakes like this until we cross above $42,000
#Hodl #Bitcoin
