Stake-based versus vote-based elections - an analysis toolkit
One of the big discussions held after the steemalliance working group elections concerned the potential inclusion of stakes in the way the votes should be accounted for.
While there were also numerous discussions about the fact the elections had been organized on discord and connected to the GinaBot, this is not the topic here. I only want to focus on the relative importance of two options for extracting the vote results: accounting either for the number of votes, for the number of stake-weighted votes or for a mix of both. Nothing more, nothing less.
The script presented below has this in mind, and aims to be useful for the design of the method underlying any potential next election to be organized. I will nevertheless illustrate it on the results partially-available from discord for what concerns the past election. We do with what we have to improve. With this respect:
- The number of votes for any candidate is truncated to 100.
- Several Steem accounts can be linked to a discord account.
Basic information
- The package is located in this GitHub folder.
- The script runs on Python 3 and requires the beem package developed by @holger80.
- Matplotlib and numpy are necessary in order to generate figures. Otherwise, the results are provided under a text format, printed to the screen.
On order to run the script, it is sufficient to type
bin/analysis <path-to-inputs>
from the script folder, where <path-to-inputs> points to the input file.
The figures, if matplotlib and numpy are available, are generated in the main folder.
Code details
The code starts by verifying the compatibility with the available Python version. Python 3.X is indeed required.Then, a colored logger is loaded (although it is not heavily used, it is good to have one at our disposal for future developments). The corresponding file where the logger is defined is located in src/colored_log.py, and comes from MadAnalysis 5 (one of the codes I develop for the high-energy physics community).
After that, a check of the provided argument (the <path-to-inputs> introduced above) is performed, and a welcome message is printed to the screen. One single argument must be provided, and it must be the path to an existing file. All of this is encoded in the src/system.py file.

The next step consist in reading the JSON file, with the simple routine presented in src/reader.py. This is where extra readers may need to be included to ensure compatibility with different input formats (CSV for instance). An exception is generated if the JSON-formatted file is corrupted.
After reading, the input is reorganized as a list of 2-tuples (one per vote) containing the Steem accounts associated with a given vote, and the candidates that have been voted for. The src/reader.py file contains also a routine determining the stake value of the vote, by summing the stakes associated with all the corresponding Steem accounts (thanks to the usage of beem).
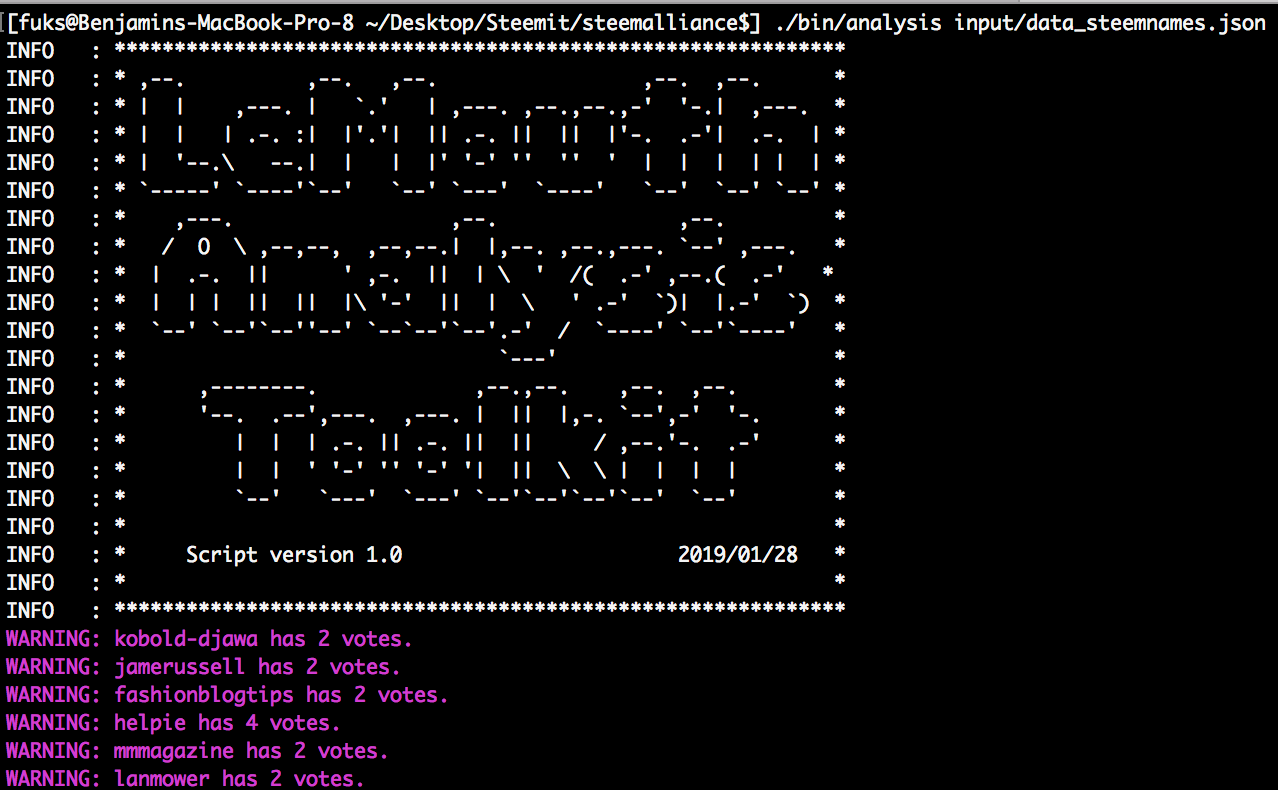
A given Steem account can in principle be allocated to different votes (this is linked to the way the GinaBot works). The stakes are in this case equally shared among those different votes and a warning is printed to the screen.
The scores are finally evaluated. Two scores are returned by the method presented in src/scores.py.
The first one is based on the number of votes. Each candidate is associated with a percentage: the number of votes he got over the total number of votes.
The second score is based on the square root of the stakes. This allows for taming the differences between users, to avoid the ranking to be decided by one or two large stake-holders. Each candidate is here again associated a percentage: the number of sqrt[stakes] he got over the total number of sqrt[stakes].
This src/scores.py file is the file to modify if one wants to try other options for evaluating the election results.
Finally, two figures are generated (if matplotlib and numpy are available) from the routines in src/plotter.py. One concerns all candidates, and the other one zooms in the top 15 candidates.
The curves that are extracted corresponds to the final score when one gives a weight x to the stakes. For x=0, only the stakes are accounted for while for x=1, stakes do not matter. Anything in the middle weights the stakes and the number of votes accordingly.
Results
Here are the results obtained from the provided input file.


I restrain myself from analyzing those results, but feel free to play with the code, make tests and report us your findings. I hope this will be useful.
</path-to-inputs></path-to-inputs></path-to-inputs>